Sales Volume Lessens Amid Lower Home Inventory and Rising Prices – Appreciation Still Ongoing – Most Noticeably in Lower Price Ranges
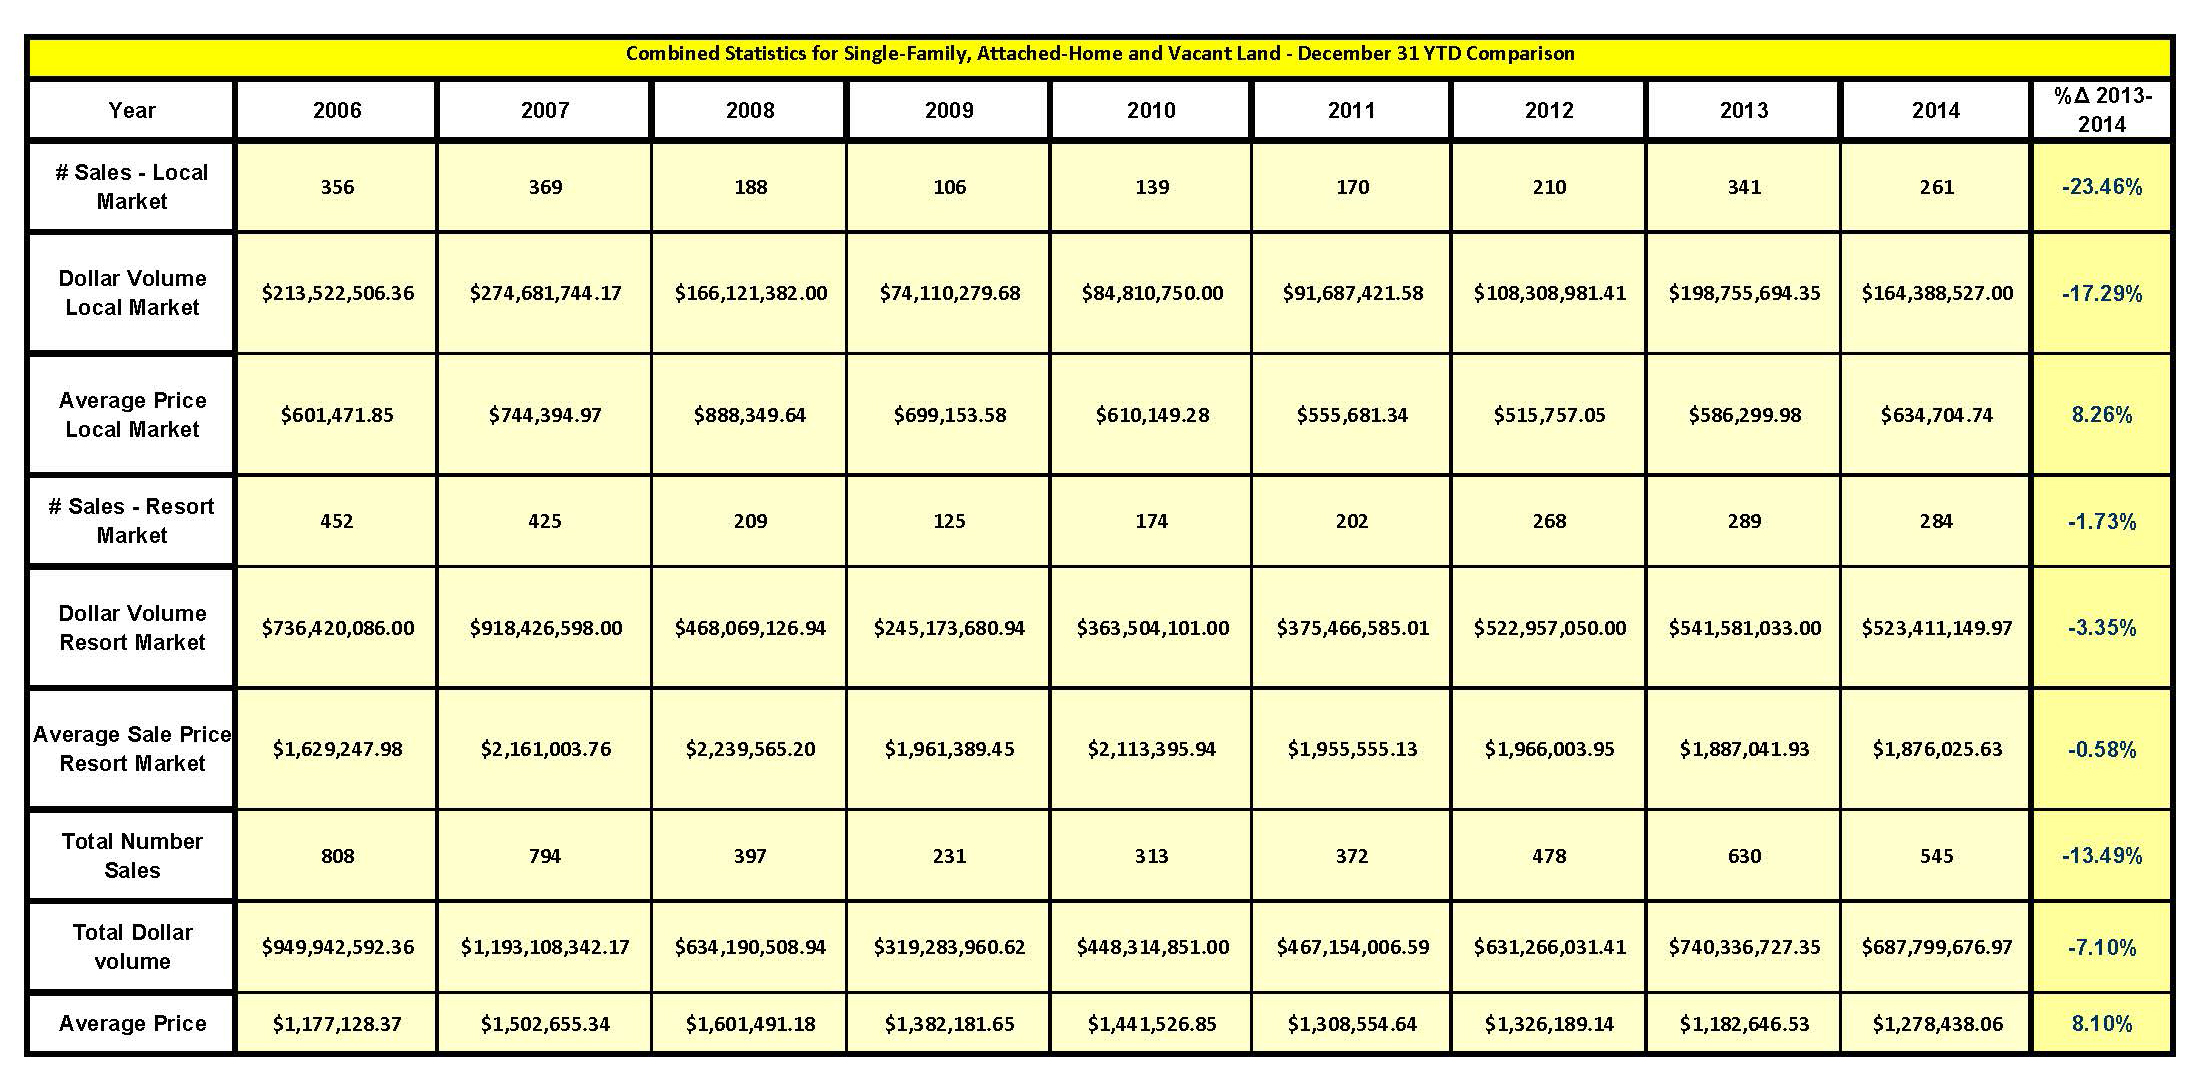
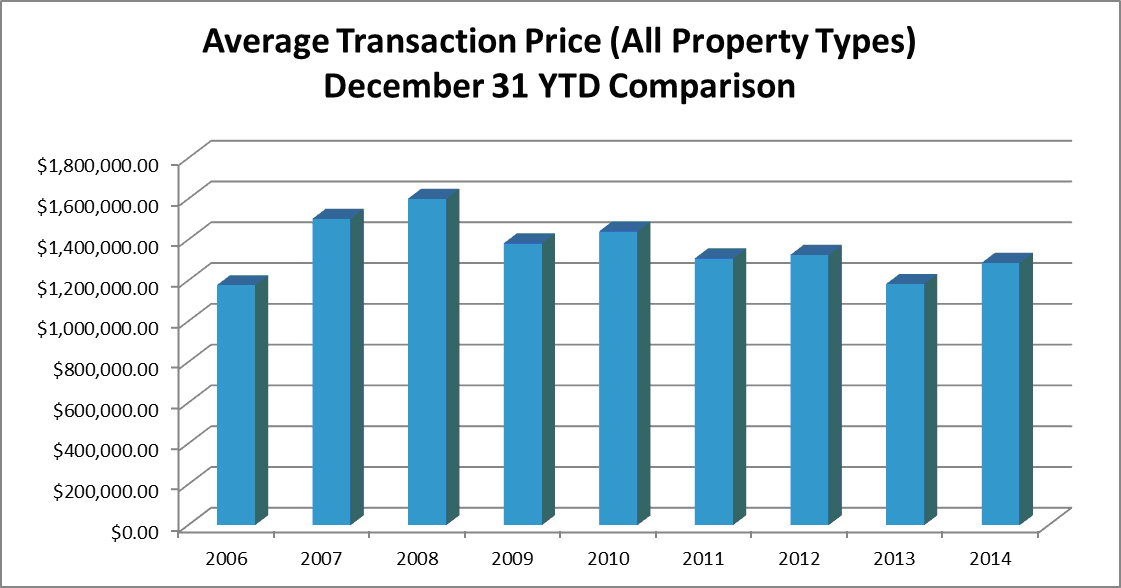
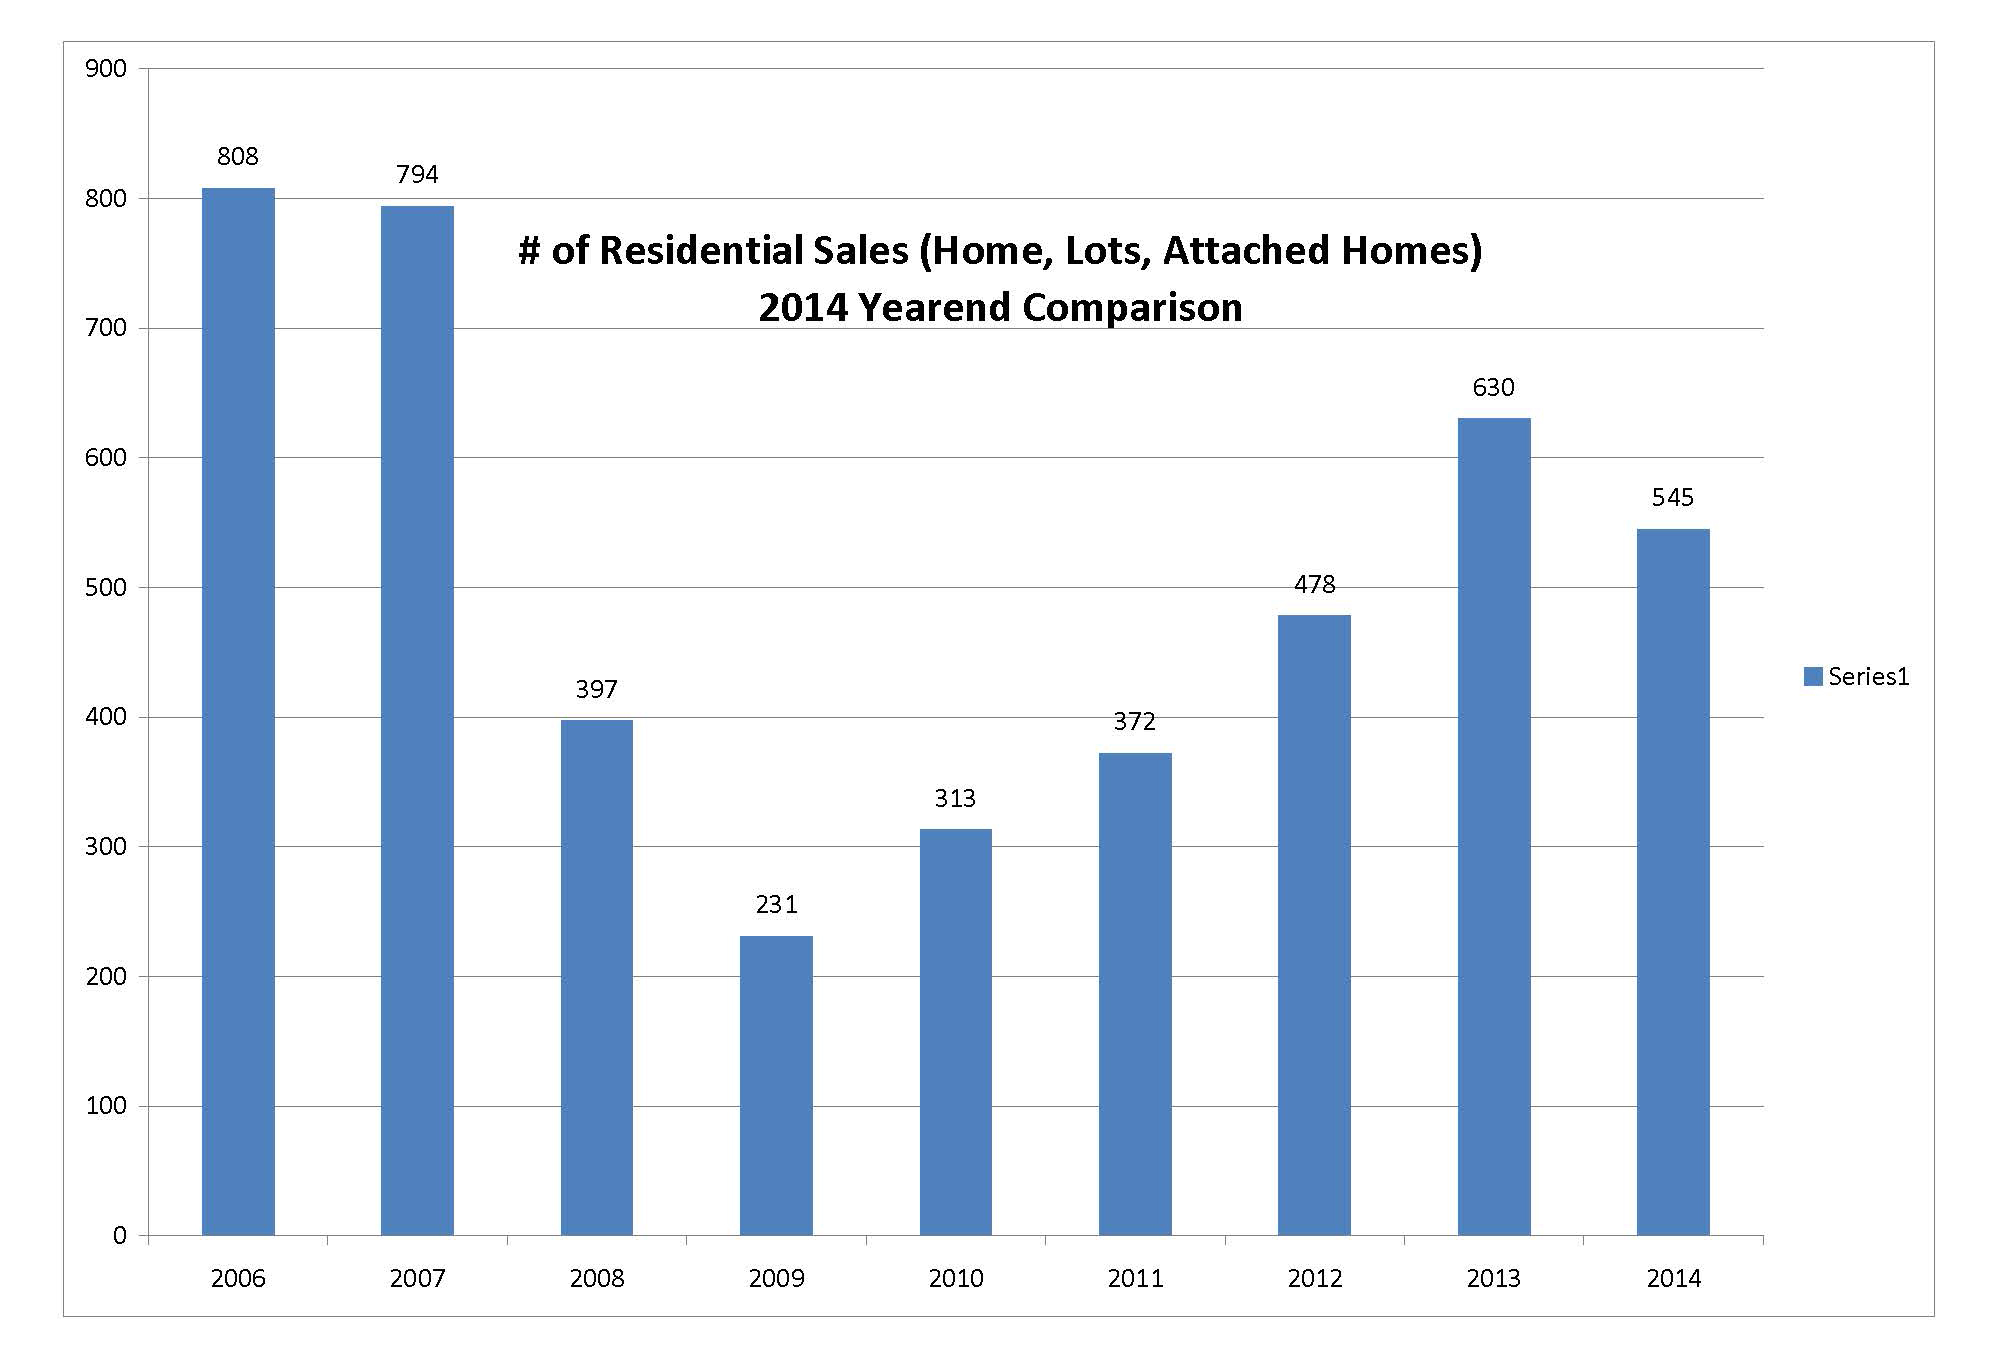
Sales data for year-end 2014 exhibited a contraction in the number of sales and total dollar volume of sales (as compared to the previous year to date) of nearly 14%. This phenomenon is attributed to a decrease in listing inventory, with the inventory as of mid-January of 2015 being approximately 20% less than it was at that time last year. As a result of this market tightening, single-family home sales are off in number by approximately 18%. The number of attached home sales and vacant land sales are also down (14% and 2% respectively) but not to the degree of detached, improved residences. It was hypothesized during the mid-year market report that the earlier recovery of the single-family housing market gave many single-family home sellers the confidence to “test the waters” with higher asking prices at the beginning of the summer sales season, causing a standoff between buyers and sellers. As of yearend, it was noted that prices remained strong despite contracting sales volume, with little or no indication of sellers lessening their expectations. The aggregated data for residential real estate sales showed an increase in average price (8.1%) from yearend 2013, with this indication hypothesized to be the result of continued appreciation in the lower-priced segments of the market and stabilized pricing at the upper end of the residential market. Notably, the aggregated date would, appear to indicate that Teton County’s more expensive properties depreciated to varying degrees during 2014. However, examination of individual property sales provides that this is not the case. Rather, a decrease in the number of luxury sales above $3,000,000 in value served to pull the average price of Teton County Luxury sales downward, but this is not at all indicative of a downward value trend, merely a fluctuation in the number of high-end sales.
Single-Family Home Sales Trends – 2014
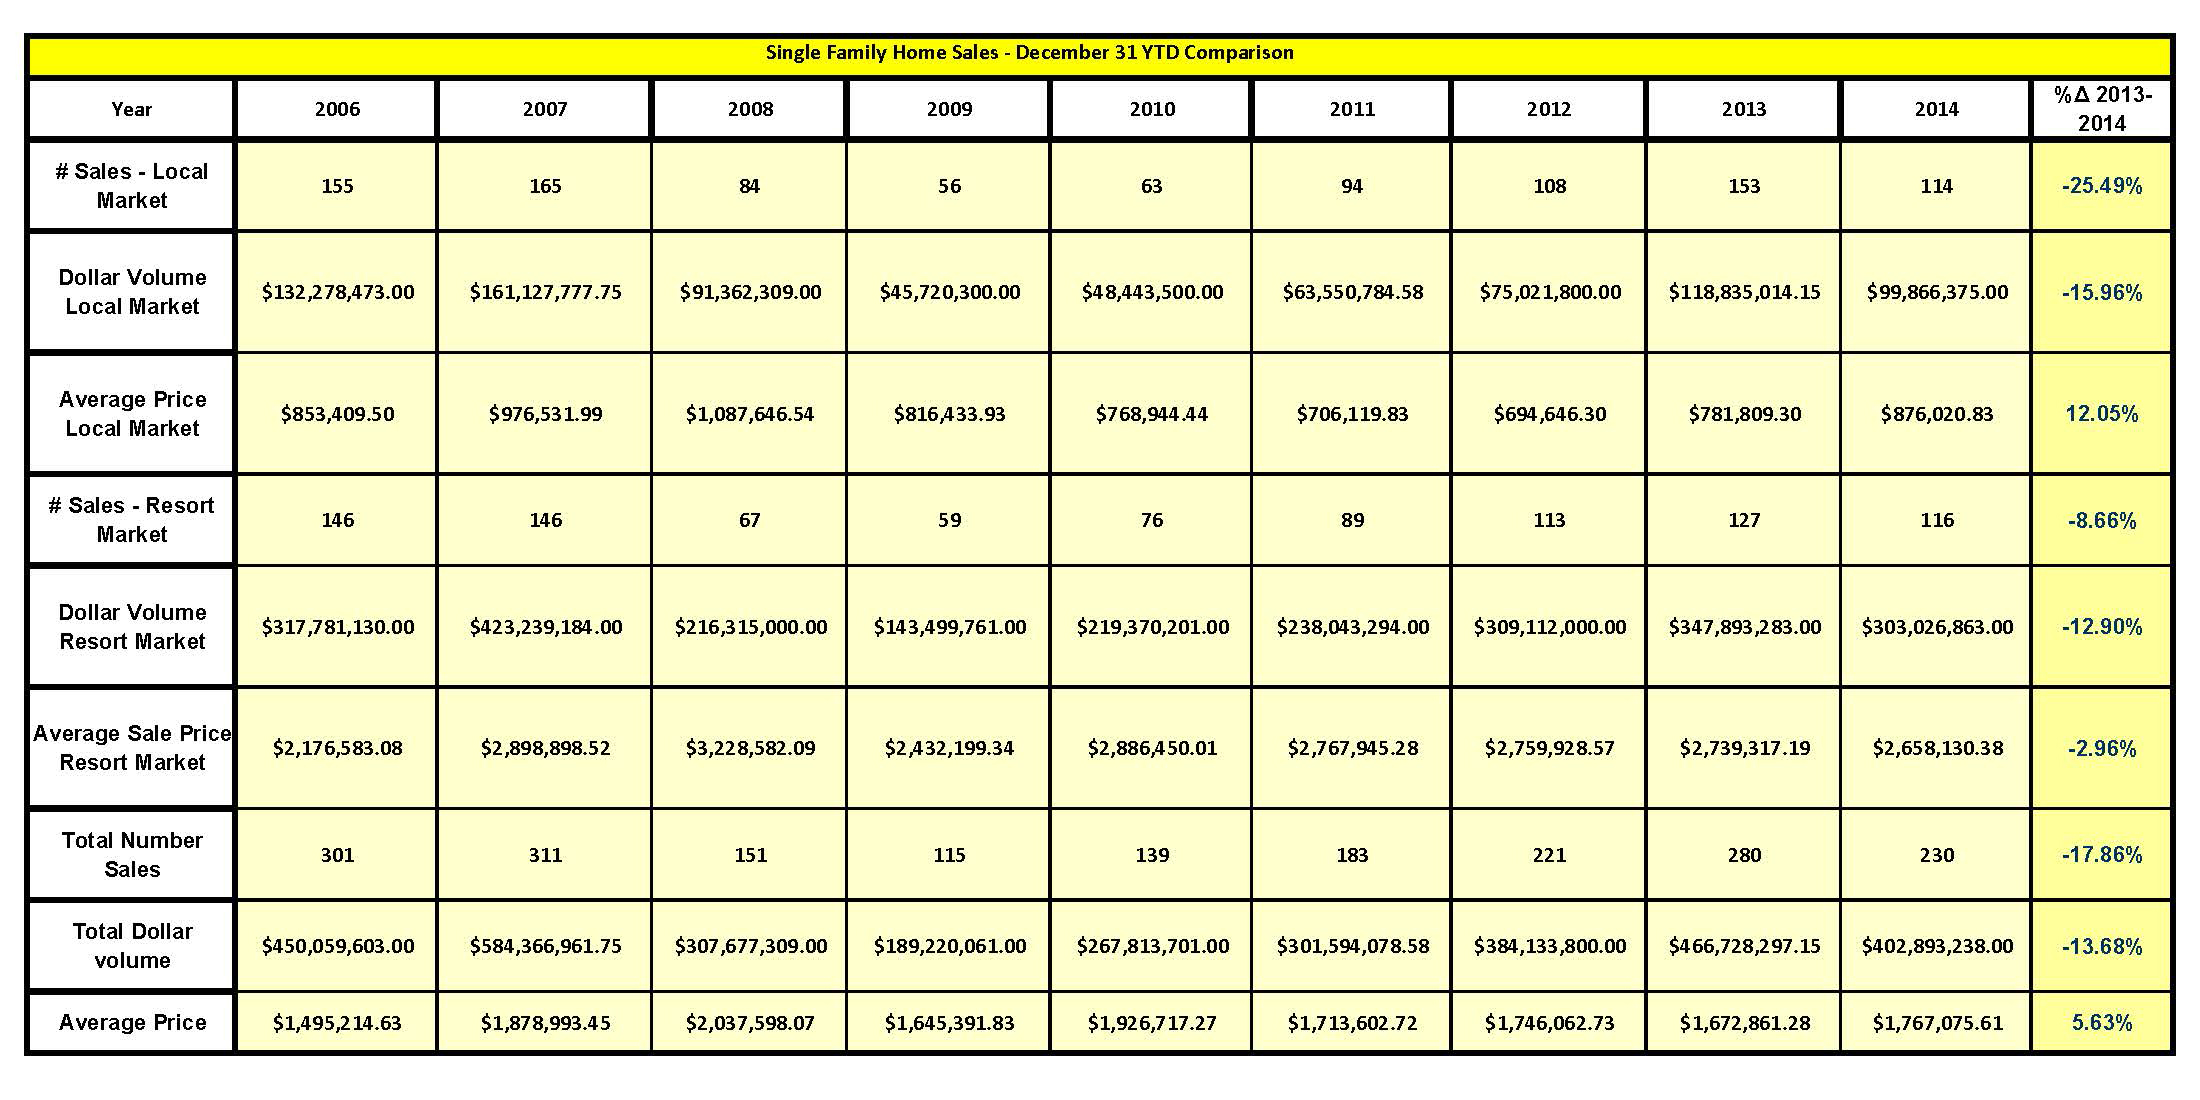 Single-Family Home Sales were off nearly 18% in number of sales as of year-end 2014, with local market bearing the brunt of this loss (an over 25% decrease as compared to a contraction of 9% for the resort market). This loss is volume opined to be fueled by limited sales inventory and upward price pressure on the existing inventory. The aggregated sales prices of single-family residences was noted to have increased nearly 6% based on the combined indication of the resort and local market.
  The observance of falling transaction numbers amidst increasing prices is indicative of a supply-driven price increases in 2014 that were being accepted, although begrudgingly, by buyers. Observation of sales and re-sales of same or similar individual properties at lower price reveals appreciation rates on either side of 1% per month (average / not compound) during 2014. The gauging of appreciation rates for higher end properties is challenging due to the limited likelihood of two nearly identical luxury properties existing, much less selling and reselling at close intervals. Nevertheless, the zero-sum implication of an overall average annual price increase of 6% with lower-end properties exhibiting price growth rates that are higher than this is that higher-end single-family residences remained relatively level in price during 2014. One theory that is gaining traction among real estate professionals is that the stall in high-end real estate prices during the declining sales volume of 2014 has shown the durability of this market segment, and set the stage for a robust market for luxury properties in 2015 as circling buyers come off the fence.
Vacant Land Sales Trends – 2014:
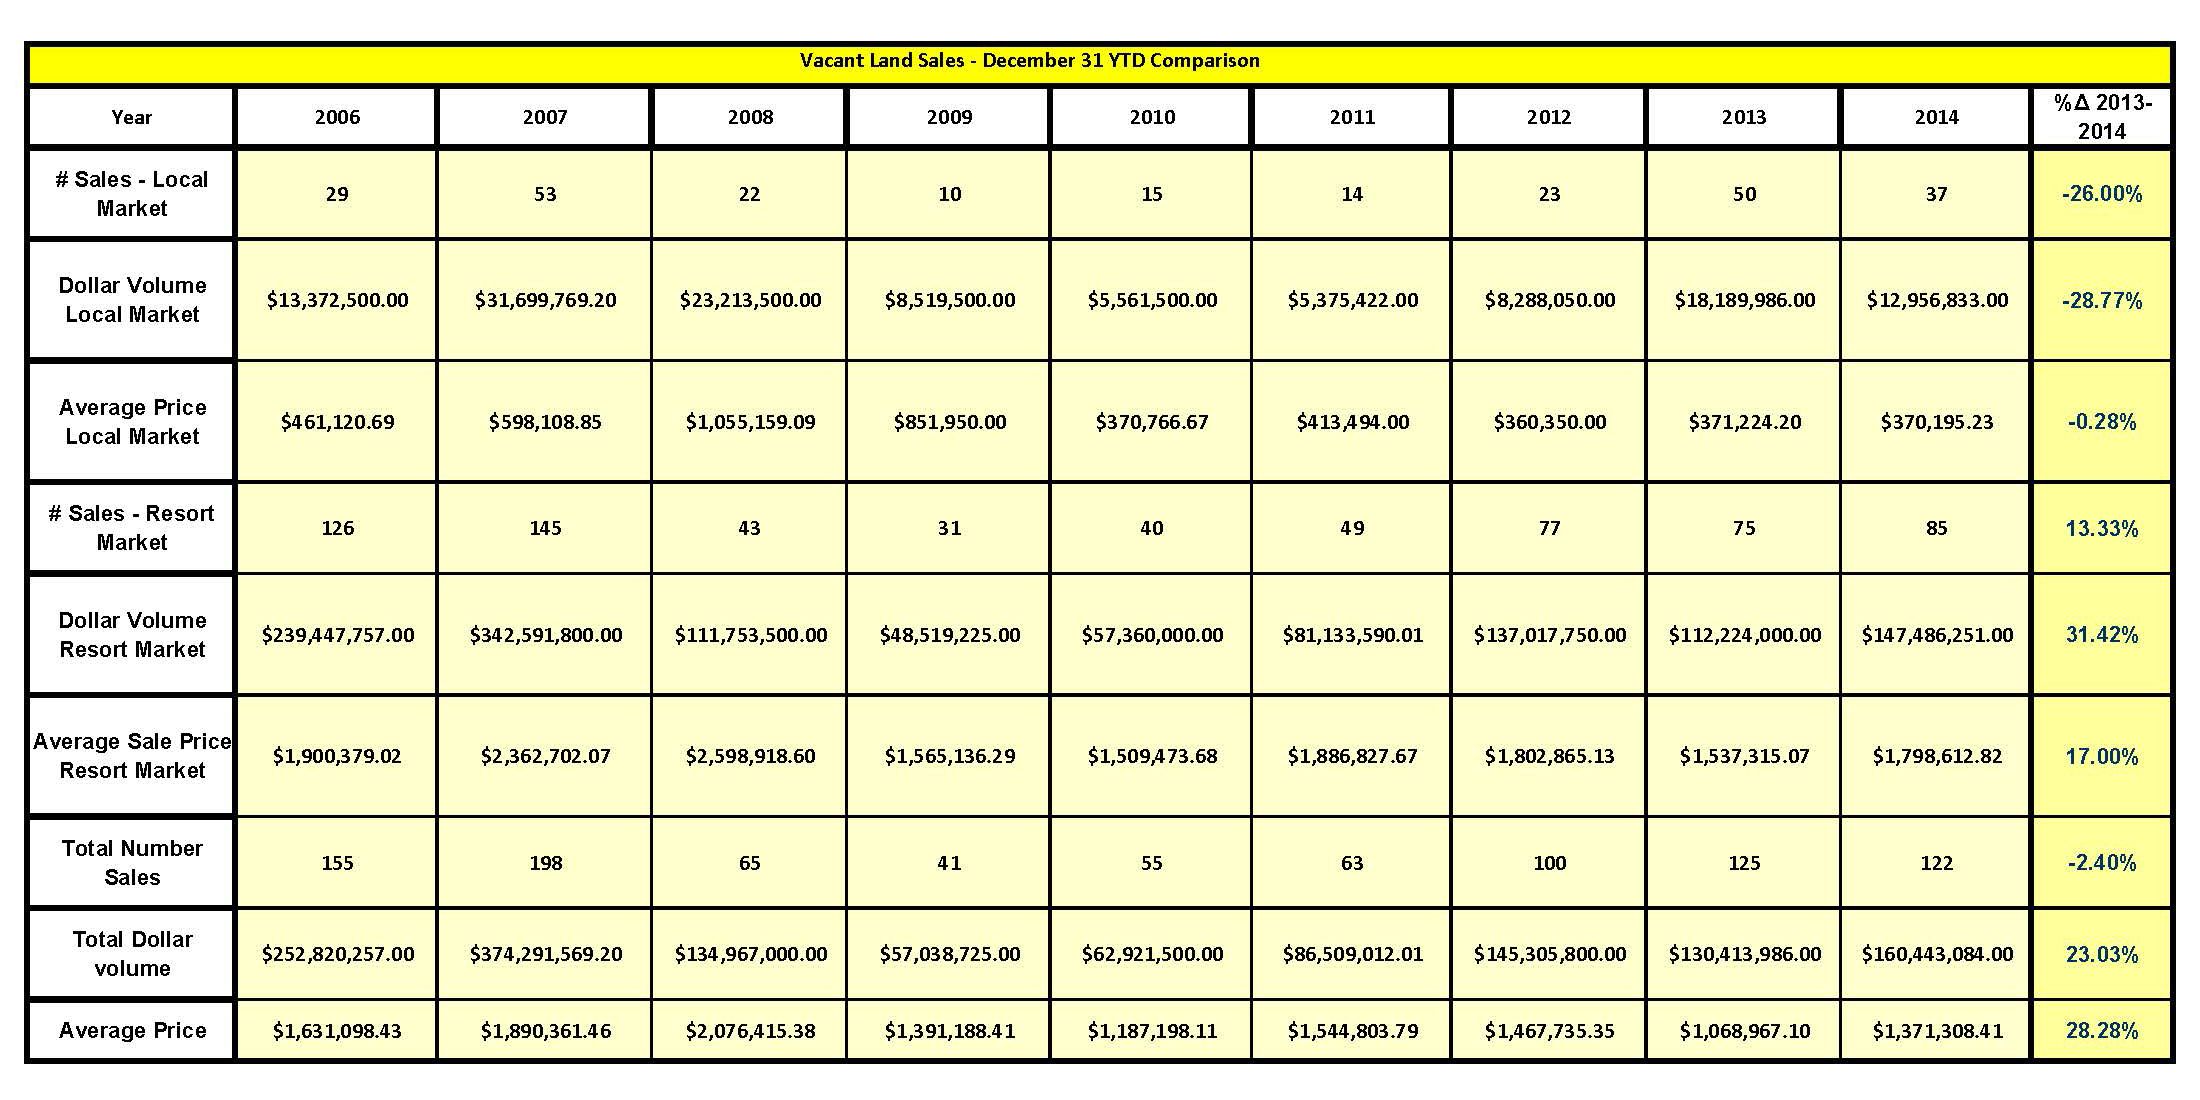 Vacant land sales decrease in number by approximately 2.4% when comparing year-end 2014 to year-end 2013. This decline is primarily the result of the lack of inventory in the local market which caused sales number decreases of 26%, as compared to the resort market, which showed a 13% increase in sales volume. Analysis of individual sales showed that, when sales did occur, homesites appreciated at rates often greater than 1% per month.
 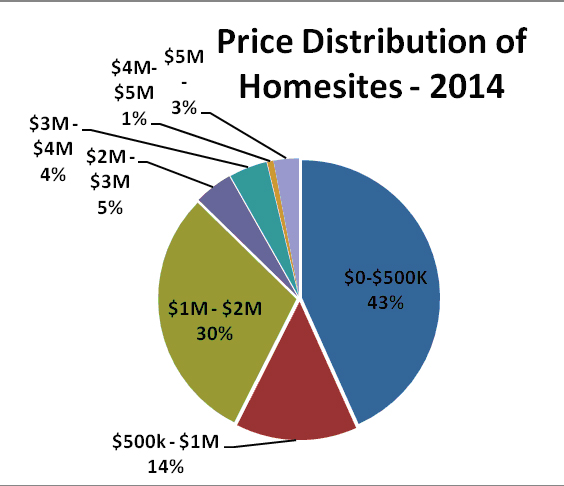 The aggregated data for resort lots supports this observation, while the local market averaged data showed a decline in average price that can be attributed to a flurry of lower-priced lots situated in Teton County’s peripheral and lower-priced locations. The growth in the price points of higher-valued lots was noted in 3 Creek Ranch, where the average price of land sales in 2014 was nearly 40% higher than that of the previous year. Sales of a lot in Bar BC in the high seven-figure range and two sales in Crescent H approaching the $5,000,000 mark added to the momentum of this market segment.
Attached Home Sales Trend – 2014
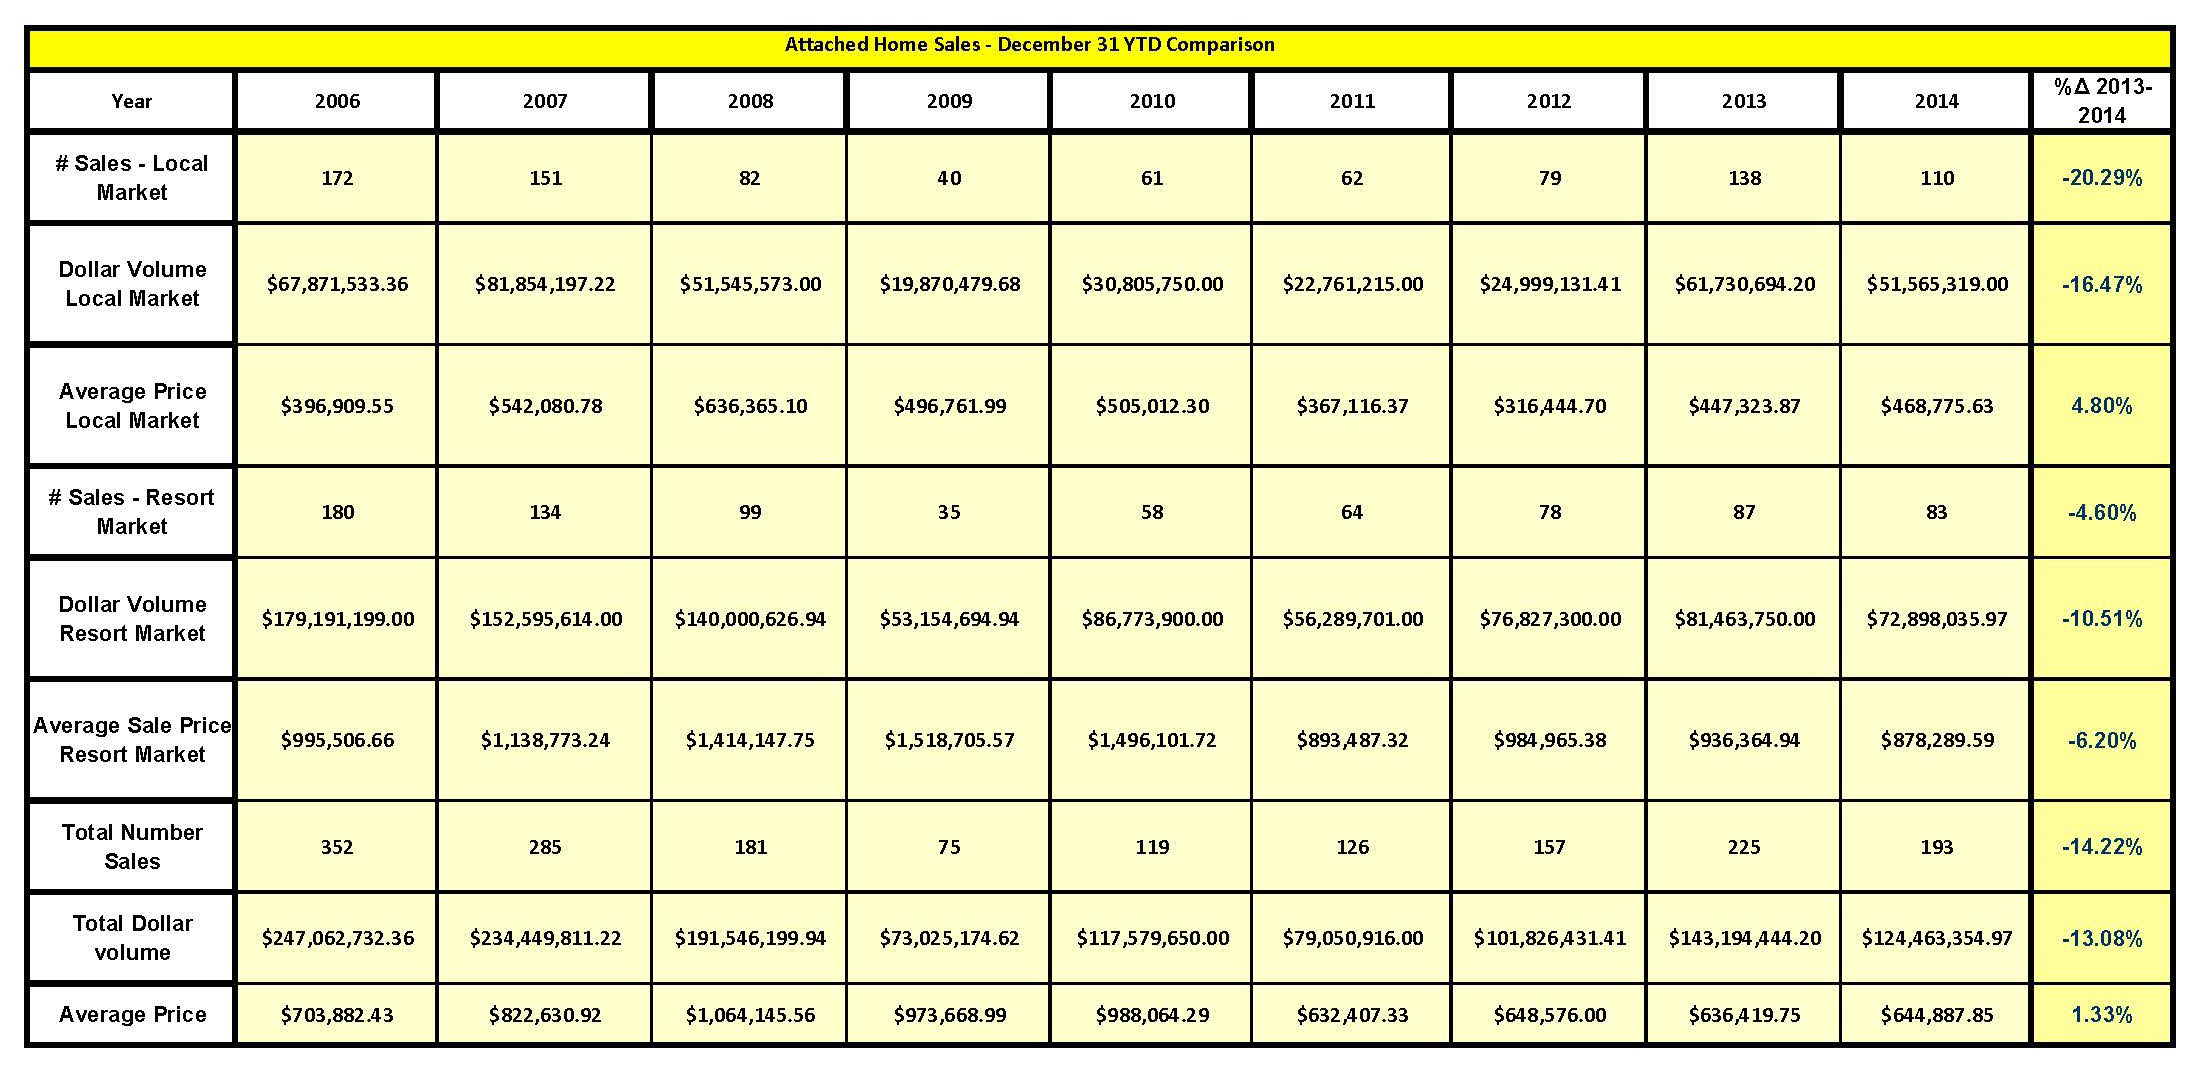 The number of attached home sales (Condominium / Townhouse) in 2014, were off from the previous year by 14%. While decreases in volume were noted in both the higher and lower market segments, the more moderately-priced local market experienced the most marked decrease, with the number of sales being over 20% less. The resort market showed a loss approaching 5%. The attached home market as a whole showed an essentially level price trend,
 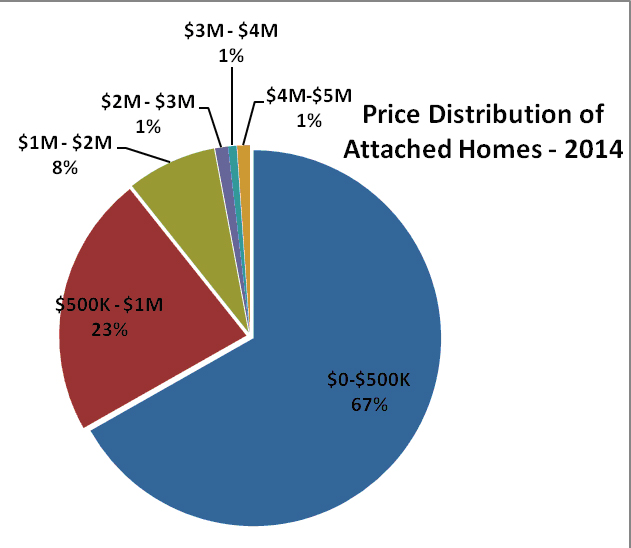 with this change being a composite of a 5% increase in the local market prices and a decrease of 6% in the resort market. As with the land and single-family markets, examination of individual sales reveals that market prices has been increasing, with growth being noted on either side of 1% per month. The fact that the aggregated data showed either depreciation or a more moderate appreciation rate (than the average) is attributed to changes in composition of the inventory of sales, not value trends.
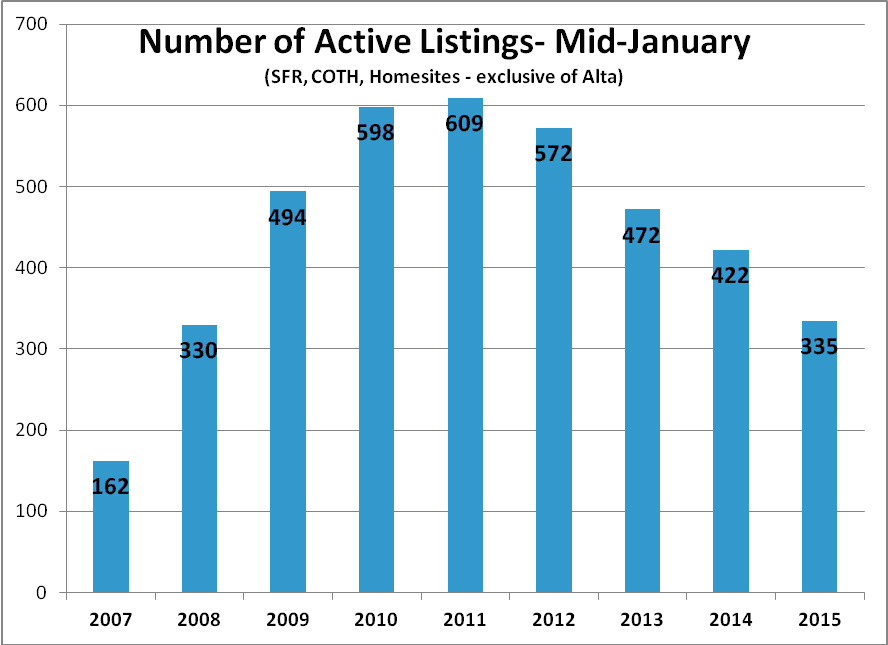
Active Inventory
The inventory of homes grew from a shortage of available inventory in 2007, to an oversupply in 2010-11, following the events of the financial crisis. Since 2011, a downward trend has been noted, with inventory being above that of 2007 levels, but at a level that is generally opined to be a shortage level. This trend continued through 2014, with inventory being down approximately 20% overall (as compared to the previous year) as of mid-January of 2015. The greatest reduction in inventory was noted in the resort areas of Teton Village and the West Bank (Aspens / Teton Village). However, a lack of more moderately-priced building sites in the Town and South of Town Market Areas was also noted
Historical Active Inventory Levels as Mid – January 2015

This market report was provided by:

START YOUR REAL ESTATE SEARCH HERE