

Gains From 2012 Shrink Slightly as Compared to August Data,
but are Substantially Up From 2009 Lows
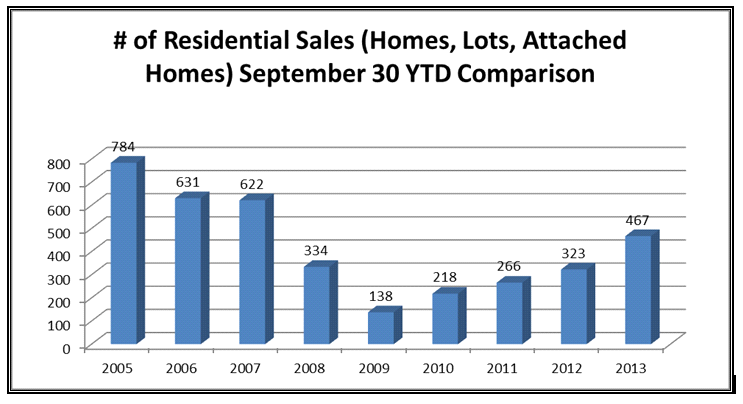
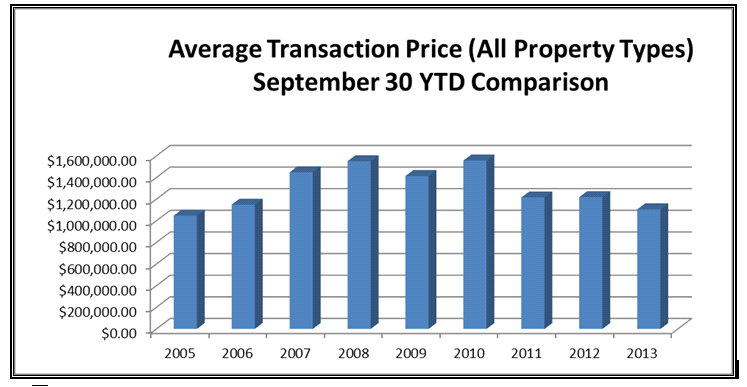
Observing data compiled through the end of September of 2013, it is noted that the number of residential real estate sales (single-family homes, attached homes, and vacant lots) are up from 323 total sales during the first nine months of last year to 467 sales during the same period of this year (an increase of over 44.58%). While slightly less than the 47% increase noted for this data at the end of August, it is still an impressive statistic in that this growth is substantially over the gain experienced between 2011 and 2012 (21.42%), which is indicative of the continued upward trajectory of the recovery. It should also be noted that the current year-to-date sale volume is only a rounded 26% less than the volume noted at this time in 2006 (the last year unaffected by the mortgage crisis of 2007). It could be argued that a mid-twenties disparity in current sales volume numbers from that of 2006 is not a measure that is indicative of a recovery. However, when noting that the 2013 YTD number of sales is 238% above the 2009 low recording of 138 sales, a more positive perspective is gained. Further indication of the ongoing recovery is that the dollar volume of sales is up over 31% from the preceding year. The average price for homesites is down over 30%. However, this was due to an anomalistic spike in multi-million dollar lot sales in 2012 that has skewed the aggregated data. This point is further corroborated by the fact that examination of individual property sales provides the indication that values, on average, have been increasing between .25% and 1% since the market reaching an inflection point in mid-2011. [1]
[1] Value trends vary between market segments and property types.
Summary of Market Statistics
(click on tables/charts to see enlarged view)
Combined Sales Data – All Property Types
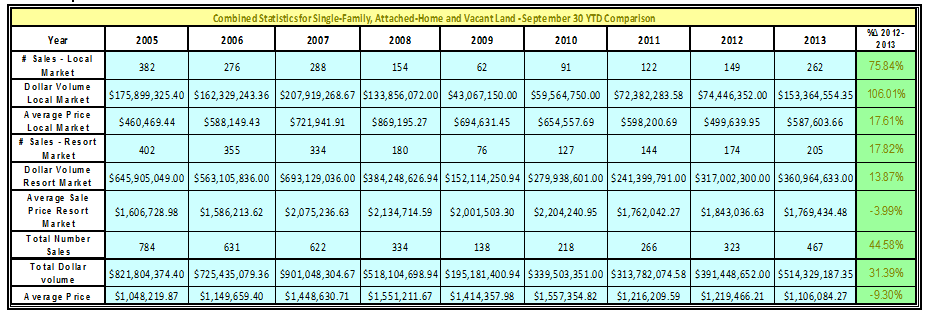
Individual Market Segment Performance
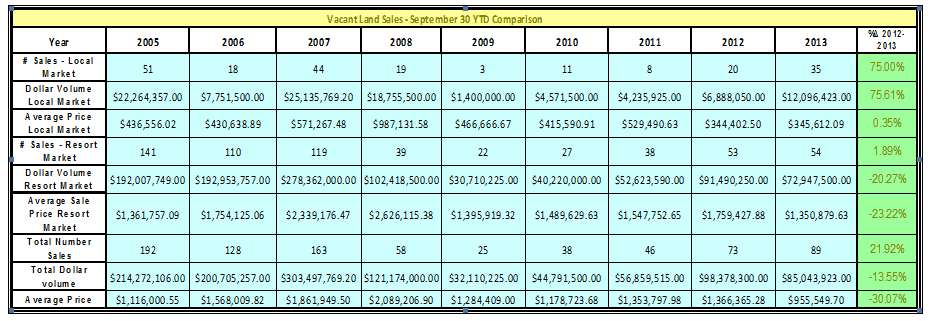
Vacant Homesite Market Segment
Data from the market for vacant land in Teton County reports an over 20% increase in transaction numbers, while providing the contradictory indication that the metrics of dollar volume of sales and average price fell 13.55% and 30.07% respectively. In actuality, the decrease in sales volume (dollars) and average price is solely due to a flurry of multi-million dollar homesite sale activity in 2012, whereby less than five very large sales skewed the data upwards. One of the greatest impediments to this market in the near future may be a lack of saleable inventory, especially at the lower end of the value range. As an example, the Teton County MLS currently only shows 18 listings less than $300,000 when excluding the Alta submarket.
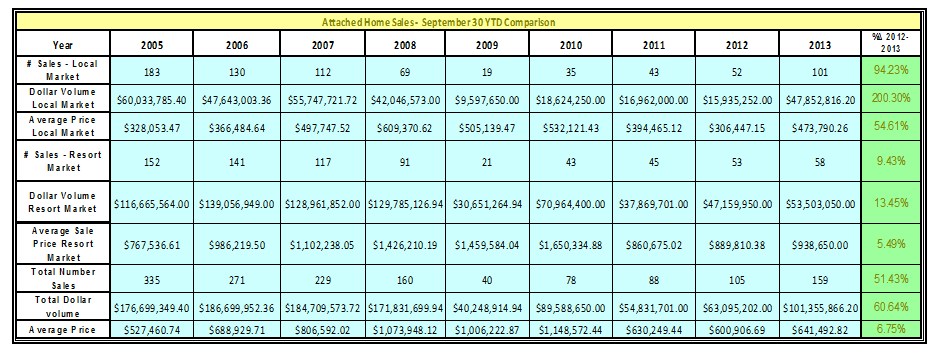
Attached Home (Condominium / Townhouse) Market Segment
The attached home market in Teton County continues to show strong growth, with sales volume up over 50% when compared to data from the end of September 2012. This growth was primarily fueled by the Local Market, which saw an over 200% growth in dollar volume of sales. The resort market showed more moderate growth in number of sales and average price, but did manage to post an over 13% growth in dollar volume of sales.
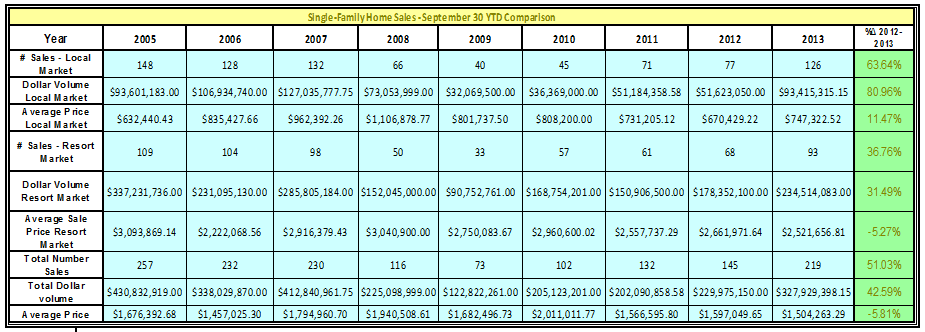
Single Family Market Segment
As with the attached and vacant land market, the single-family home market segment posted superb growth in number of sales (over 50% greater from the previous year) with dollar volume of sales showing gains in excess of 42%. A slight decrease in average sales price was portrayed in the data for this market segment. However, this is contrary to more telling comparisons of sales and resales of improved properties. The decrease in overall average sale price is; therefore, theorized to be due to the explosive growth of sales volume in the Local Market acting to dilute the overall average price indication.
Regards,
Andrew Cornish, MAI, SRA
President, Rocky Mountain Appraisals & Owner/Broker, Brokerage of the Tetons