Price Gains Continue to be Evident Through First Quarter of 2014 Less Inventory Contributing to Lower Sales Volume
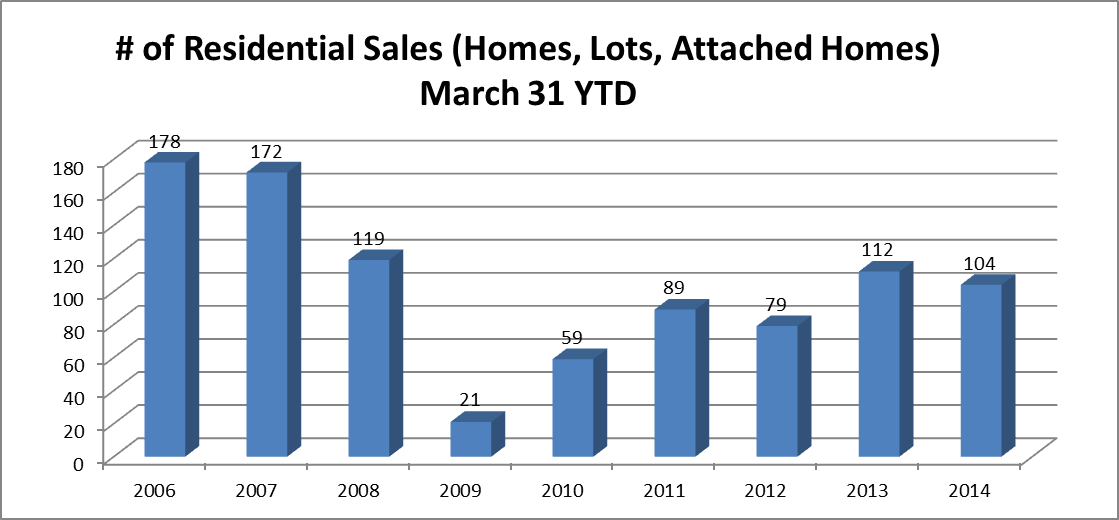
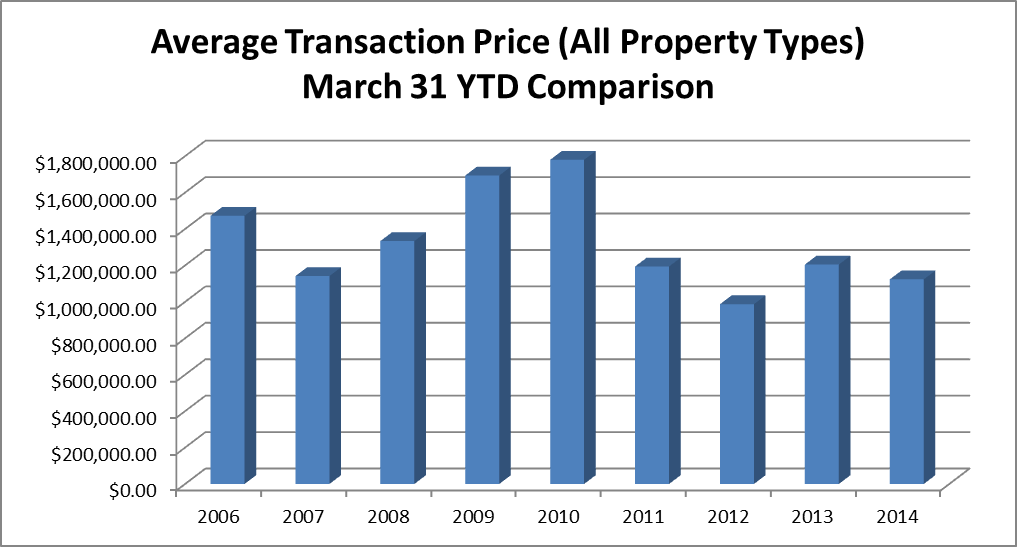
When aggregating the data for single-family homes, vacant land and attached homes, a first quarter contraction in the number of sales and total dollar volume of sales is noted. This phenomenon is attributed to a decrease in the inventory available for purchase that is reported by Realtors and real estate shoppers alike. The decrease in the number of single-family home sales (-32.69%) was the primary cause of the contracting numbers, with attached homes and vacant land sales actually showing increases in volume numbers (attached homes volume increased by 5% and vacant land sales increased in number by 35%). First quarter aggregated data also showed an overall contraction in average price. However, this is a misleading indicator that is resulting from the overall average price in the first quarter being comprised of less single-family homes (which typically exhibit higher prices) and more less expensive vacant lots and attached homes. When Aggregated Market First Quarter Comparison of Sales Data Appears to Show a Contraction in the Main Three Metrics of Number of Sales, Dollar Volume of Sales and Average Sales Price: 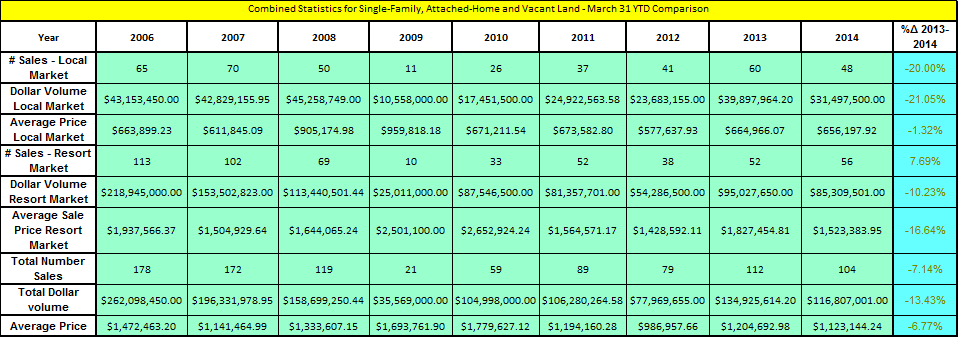

 However, despite the indications of the aggregated data, when breaking the market down by the components of single-family homes, vacant land and attached homes, it is noted that a lack of single-family home sales is providing the downward pressure on these metrics: Single-Family Home Sales Trends – First Quarter Comparisons:
 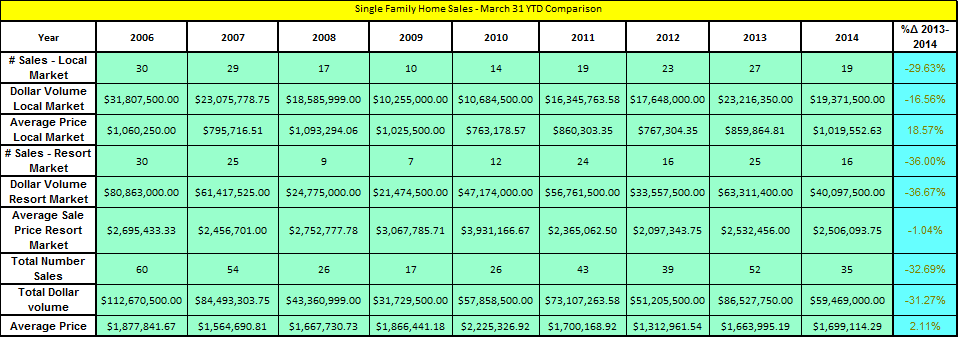 Vacant Land Sales Trends – First Quarter Comparisons:
 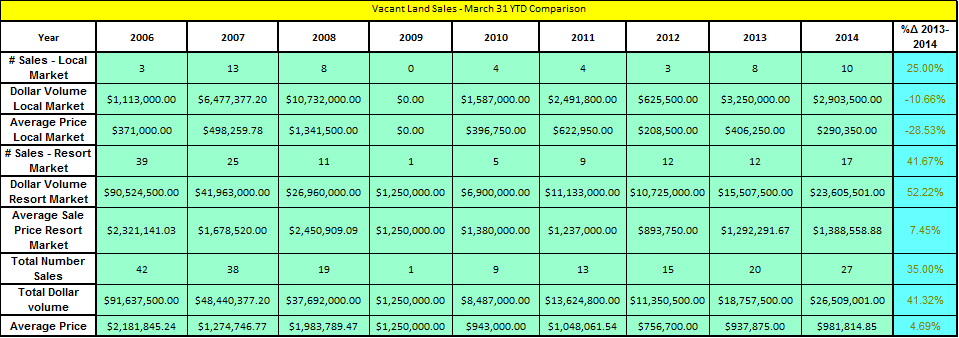 Attached Home Sales Trend – First Quarter Comparison
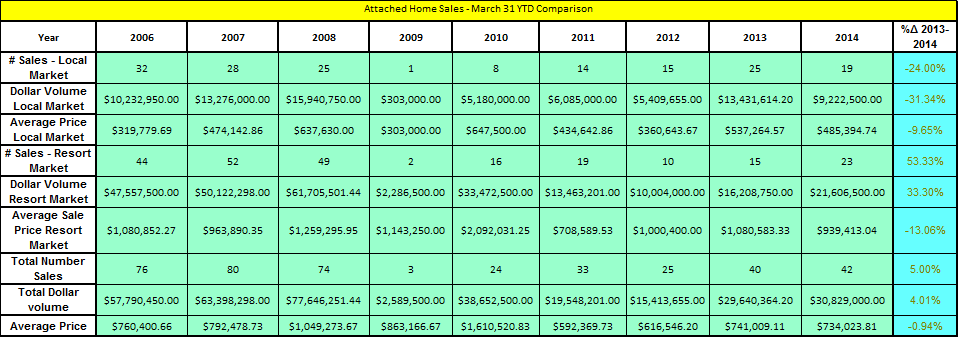

In the preceding tables, it is noted that the indicators number of sales, average sales price and dollar volume of sales exhibit stable-to-increasing trends for vacant land and attached homes, while the number of sales and dollar volume of sales measures contracted for single-family homes. The contraction of sales volume for single-family homes can be largely attributed to the continuing contraction in available inventory, as shown by the below comparison of active listings from May, 2013 to May, 2014: 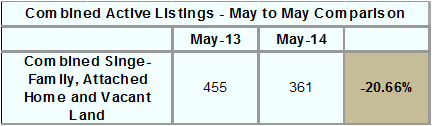
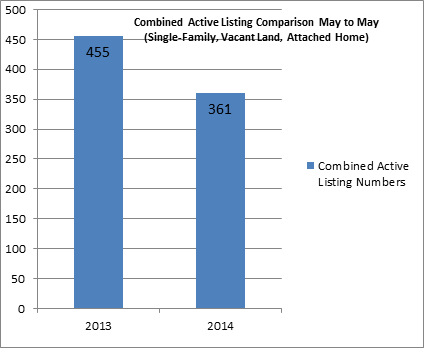 Segmenting the inventory by property type, it can be noted that single-family homes experienced an over 23% drop in inventory when comparing this May to last May.
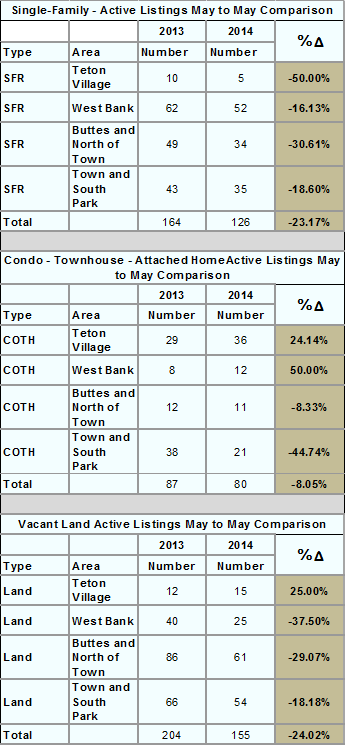

Notably, vacant land listings declined in an amount slightly greater than improved homes, but did not experience the same contraction in sales volume. This is hypothesized to be the result of would-be homeowners gravitating toward the option of building their own home, as many market participants find locating the ideal home more challenging in the shrinking inventory of existing homes. This increased demand for vacant land has caused an upward pressure on pricing in the vacant land market, as is shown in the following table which uses the price progression of vacant lots as a measuring stick for price growth. 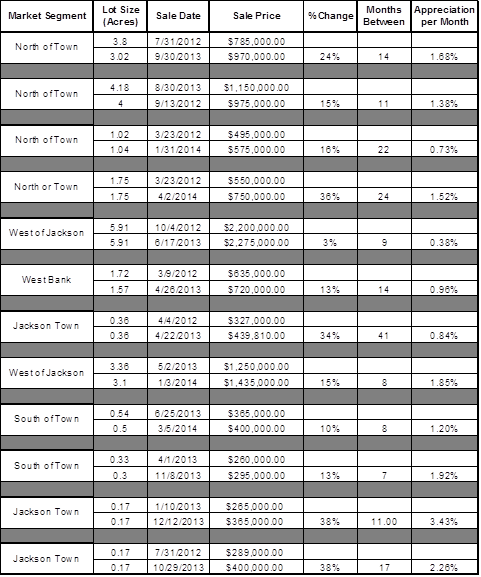

The Brokerage Team For Your Real Estate Needs
Andrew@RESJH.com
Todd@RESJH.com
Data provided by Rocky Mountain Appraisals, Teton County’s leading valuation firm: