2012 Real Estate Summary
Andrew Cornish MAI, SRA
1315 S. Hwy 89, Suite 201
appraiser@rmappraisals.com – 307.733.7799
Residential & Commercial
Residential Real Estate
As we move into the middle of the third quarter of 2012, many market segments have experienced their first point of year-to-year comparison where value loss was not experienced. Notably, attached homes (condominiums and townhomes) and single-family detached homes did have lower average sales prices as compared to this point in time last year. However, this appears to be due to an increase in the sales volume of lower end real estate than to continued value erosion (for most market segments). The general theme for the real estate market when viewing data through early August has been an increased number of sales transactions (24.62%), but with these transactions occurring at lower price points (average transaction price fell by 8.4%). The result of this relationship was that the dollar volume of real estate sold was essentially level from the previous year.
 To further analyze the most current trends in the Teton County Real Estate Market, the market segments of single-family home sales, vacant homesite sales, and condominium / townhome sales will first be examined without differentiation between the higher-end resort segment of the market and the more moderately priced market segment. Each of these data sets was then allocated between its higher-end and more moderately priced components for further analysis and comparison to data from previous years.
I. Single Family Residences
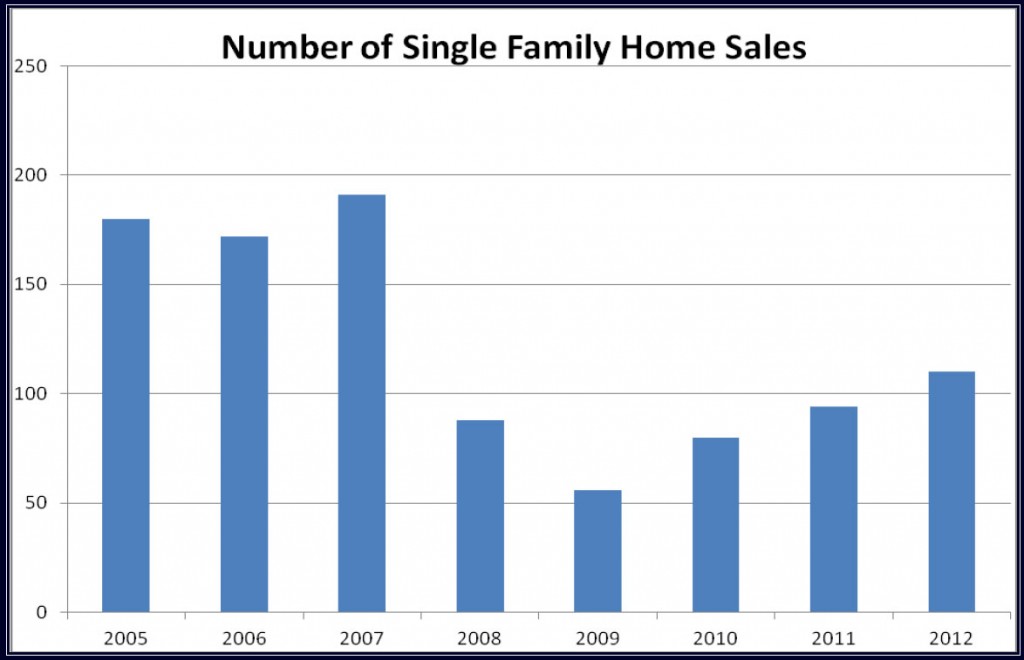
Reviewing the sales data through early August for detached single-family residences for 2012 as compared to 2011, an increase in the number of sales of 17.02% was noted. However, a decrease in the average transaction price of nearly 11% negated much of the gains in transaction numbers, and dollar volume of sales decreased approximately 5% as a result.

 Allocation Between “Resort / Second Home” and “Local” Market
Historically, the Teton County Market Area has been able to be segmented into its components of homes having their greatest appeal to market participants whose income is largely dependent on the local economy, versus homes that are more likely to appeal to second home purchasers and investors whose wealth is not necessarily tied to the local economy. Examples of the former category would be homes in developments such as Cottonwood Park, Melody Ranch, and the incorporated Jackson area. Examples of the latter area include homes located on the “West Bank” of the Snake River, north of Jackson, and the Teton Village area. The following table allocates the single family home sales between these segments:
 Both the local market and resort market segment posted significant gains in number of transactions. With both of these markets showing gains approximating 17%. However, while the local market showed a nearly 10% increase in average transaction price, the resort market experienced an over 8% decrease in this metric. Considering the number of transactions comprising the sample size, neither of these indications is interpreted as a year-over-year value trend, but rather the result of the changing composition of the types of properties included in the groupings of each of these market segments. Examination of sales and re-sales of similar properties from both the local and resort market segments imply a relatively stable value trend. As a sample of this data, four single-family homes with three bedroom and sizes ranging from 1,300 to 1,700 in Rafter J Ranch sold in 2012. These homes sold at an average value of $331 per square foot. Currently, the average per square foot value of similar active listings is $348 per square foot. This gives the indication of value erosion being arrested. However, it should be noted that, included in this average, is a motivated seller who has not been able to sell their property in over 100 days at a price of $280 per square foot. This would indicate that the potential for motivated sellers to retard the recovery of the market is still very real.
Luxury Home Submarket of the Resort-Orientated Market Segment
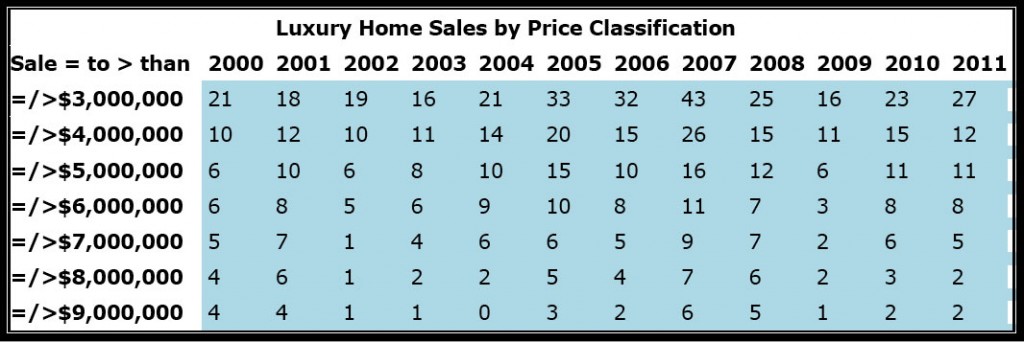
Included in the above-discussed resort orientated market segment is the submarket of luxury homes, the most expensive and unique homes of the single-family market. Observation of this value grouping reveals that 27 sales equal to or above $3,000,000 occurred in 2011. This number is similar to the numbers noted in the years of 2000 and 2004 (and only slightly less than the sales numbers for 2005 – 2006). While still less than that of the high-water mark of 2007, the fact that a number in the high twenties was attained this year is a sign of the continued strength of the most expensive value segment of the single-family home market. In viewing sales through August of 2012, it appears that the high-end of the market is continuing to remain strong, with 12 properties having reported sales prices being equal to or greater than $3,000,000.
 II. Single-Family Homesite Sales
Observing data for vacant homesites through the first week in August as a year-over-year comparison, increases in the three main metrics of number of sales, average transaction price, and dollar volume of sales were noted. Notably, after four years of being one of the least active market segments, vacant building sites showed the strongest percentage rebound in number of sales (68.75%) of any market segment, with a reported 54 homesite sales.

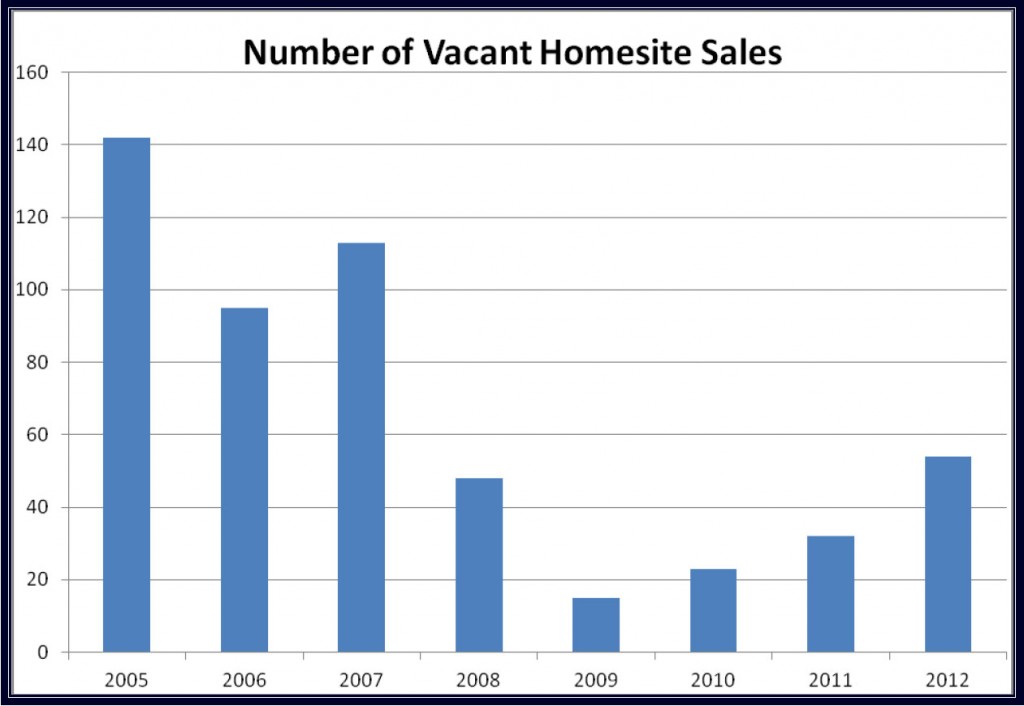 This number (54 sales) accounts for 22.22% of the total number of real estate transaction (combined single-family, homesite and attached home) for the observed period, which is higher than 14.29% – 17.39% range that had been observed over the preceding four years and similar to the market share observed during the more robust years of 2005–2007 (19.96%-24.32%). This provides the indication that market participants may be again more readily considering the prospect of new home construction and are abandoning the view that vacant land is the unwanted item of the market place.
 Allocation Between “Resort / Second Home” and “Local” Market
As was done with single-family residences, the market for vacant homesites was, for analysis, allocated into its component parts of the “resort” and “local” markets. The following table summarizes this allocation:
 From the above data it is noted that both the local and resort market experienced growth in the number of sales occurring, with the locals market gaining more on a percentage basis, but less in absolute numbers. The average sales price decreased for the local market and showed gains for the resort market. However, this was not due to value erosion in the local market or appreciation in the resort market segment. Rather, a prevalence of smaller in-town lot sales pulled the average down for the local market, while resort sales averages were skewed upward by an increase in sales in volume in some of the most expensive addresses such as Shooting Star and Bar BC Ranches. Notably, due to the price points of these lots, the dollar volume of sales increased by over $14,000,000 for this segment.
III. Condominium and Townhome Market
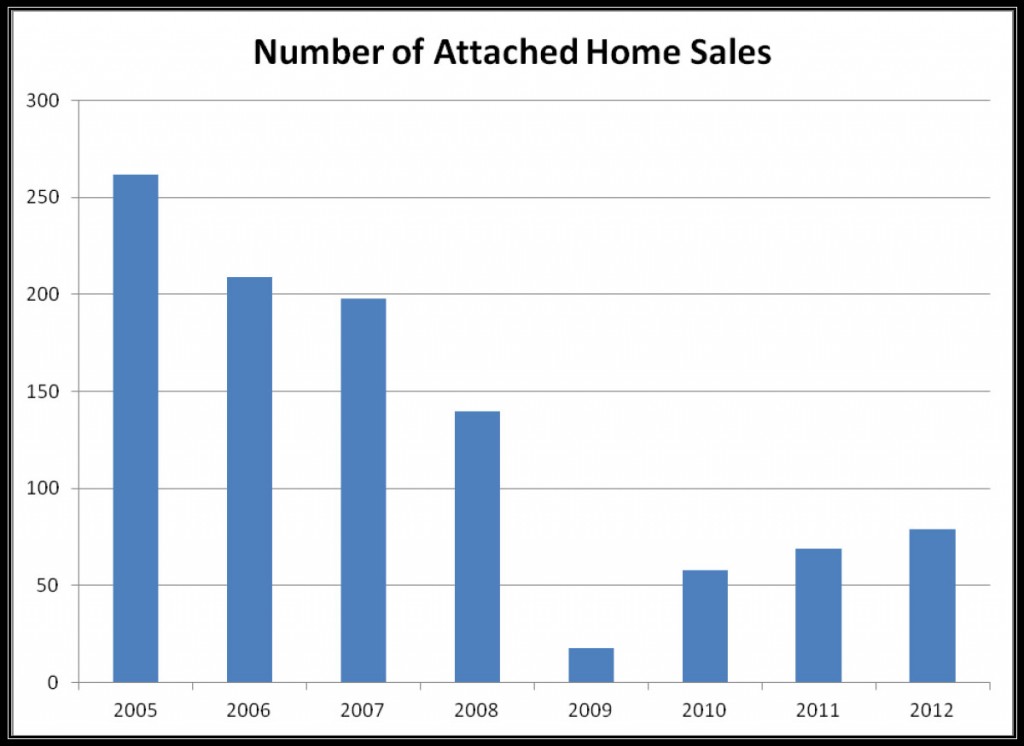
Observing data through the first week in August, an increase in the number of transaction of over 14% was noted in comparison to 2011 data from this time period. However, this gain came in combination with a nearly 16% drop in average transaction price, the result of these offsetting metrics was a drop in dollar volume of sales of slightly more than 17%. Before this information is interpreted as being ultimately discouraging, it should be noted that this drop in dollar volume of sales is significantly less than nearly 50% decrease in this metric noted the previous year. Furthermore, as will be discussed subsequently, the decrease in average transaction price for this market segment is observed to be largely due to the changing composition of sales. It is therefore, opined that the attached home segment of the market has not experienced significant devaluation since the beginning of the year, likely loosing between 0-3% of pricing value on average.
 Allocation Between “Resort / Second Home” and “Local” Market
As was done with single-family residences and homesites, the market for attached homes for analysis, was allocated into its component parts of the “resort” and “local” markets. The following table summarizes this allocation:
 Observing the data when allocated by market segment, it is noted that both the local-oriented market and the resort market experienced a sales pattern whereby an increase in number of sales was more than offset by a drop in average transaction price, with the end result being a decrease in dollar volume of sales in magnitudes from the mid-to-upper teens. However, closer examination of the underlying data indicates that this loss is the result of different types of units selling rather than value loss. As examples, the sold inventory of the local market segment for the period under observation for 2012 was comprised of smaller condominiums such as those existing in the Meadowbrook, Ponderosa Village, and High Teton Developments than the previous year. Similarly, the sold inventory for the resort market segment was more heavily dominated in 2012 by condominiums from the north-of-town market area surrounding the Jackson Hole Golf & Tennis. This is in contrast to the previous year-to-date period which was more heavily influenced by more expensive units located proximally to Teton Village.
IV. The Supply Side
When considering the health of a real estate market, it is important to consider available inventory as well as historical demand.
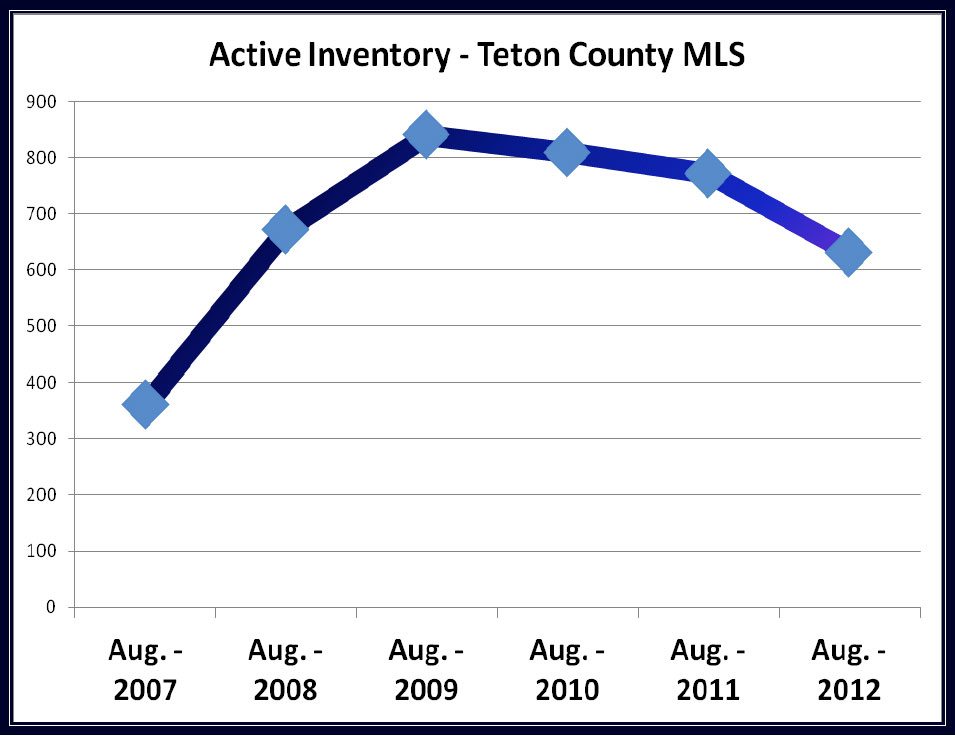
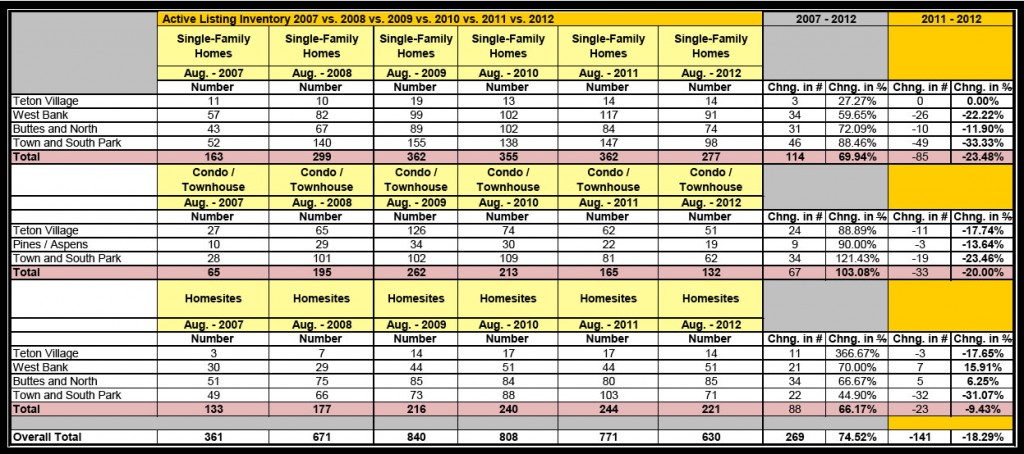 As shown in the preceding table, subsequent to the onset of the economic downturn in 2008, the inventory of available property increased dramatically. This trend continued through 2009, at which point inventory began to slowly contract. Comparing year-to-date data from August of this year to August of last year, a decrease in overall inventory of 18.29% is noted. And, while current inventory level are currently over 74% greater than that as noted in August of 2007, this improvement is certainly construed as a move in the right direction.
 In Summary
The Teton County Real Estate Market had, in recent history, experienced robust growth in sales volume and price. This trend continued through 2007 and into 2008 for some market segments, with the onset of recessionary tendencies triggered by what has come to be referred to as the “mortgage crisis” not causing a significant impact to 2007 numbers. However, review of mid-fall 2008 numbers indicated that a market slowdown had settled on the local real estate market with year-end price points and active listing data signifying that a price correction has occurred. By year-end 2008, evidence of the correction had become tangible in most market segments in regard to decreases in the number of sales. This correction solidified itself during 2009, with all but the luxury real estate market demonstrating value loss of at least 30%. Value erosion then continued through 2010 and the first half of 2011, with value loss overall reaching at least as high as 45% – 65% in some market segments. Beginning in the middle of 2011 the market began showing signs of stabilization, with this trend continuing to materialize in 2012 to date. With an observed decline in active inventory occurring, market participants are hopeful that some price appreciation may occur in the upcoming year. However, with inventory levels still high in comparison to historic levels, forecast of level prices is more likely.
Real Estate – Commercial
Trend analysis of the Teton County commercial real estate market is hampered due to the size of the market area. That is to say that the relatively small number of commercial real estate transactions occurring create a situation where one sale can easily skew average and median price data. Therefore, the health of the Teton County commercial real estate market is most accurately described without heavy dependence on statistical measures. Furthermore, while the following discussion addresses the number and range in value of the commercial sales in various commercial categories, the mixed-use nature of many properties, as well as the recent trend of properties being purchased for redevelopment allow for ambiguity in the interpretation of several of these sales. When examining recent trends in rent and vacancy levels, it is evident that value erosion has occurred throughout all segments of the commercial real estate market. Perhaps the hardest hit of commercial market segments has been development parcels that were slated to be redeveloped with mixed use buildings featuring ground floor retail and high-end residential condominiums on their upper floors. Redevelopment of these parcels is now not economically feasible. With the aforementioned lack of sales for this property type, gauging the level of value loss is difficult. However, when considering the combined effect of value loss of the residential product, hypothesized sluggish absorption of that product and the decrease in retail and office rental rates, a considerable value loss is theorized.
Retail Market – The retail market for 2011 saw six sales, a marked improvement over the retail market in 2010, which saw one sale. Notably, two of these sales were related to the ownership of the Wort Hotel assembling the land surrounding that property. Rents for this market segment can range from $10.00 per square foot for large retail spaces suitable for tenants such as Staples and the Dollar Store, to approaching $50.00 per square foot for spaces in proximity to the Jackson Town Square – with smaller “kiosk” spaces renting for even more. In 2012 year-to-date, the commercial market continues to be active, with six retail-oriented sales occurring. Most of these sales were purchased for owner occupancy. However, estimation of economic returns provides the indication of continued bullish purchases, with overall rates ranging between the 4-6% range.
Office Market – The office market for 2011 saw five sales of office space and one mixed use sale that was counted as retail, but could be described either way. This is over the office market in 2010, which saw one sale of office space. The shortage of office space that existed in 2007 spilled over into early 2008, before the contracting economy was acknowledged in this market segment. The contracting economy’s affect on this segment had been compounded by the completion of several large projects. The result of this lack of demand and increased inventory has forced rental rates for office property downward. Properties previously thought to have rental rates above $30.00 per square foot are now being observed rented for around $20.00 per foot. This trend began to stabilize during the summer of 2011, with some larger office projects that had been completed near the peak of the market achieving stabilized occupancy. However, this gain in occupancy of the newer, larger projects was at the expense of many of the smaller, second tier spaces, as there was not a notable influx of start up businesses. By the end of 2011, however, second tier spaces were showing improved vacancy as well and a general decrease in vacancy rates overall was observed. Looking at the sales data from 2012 as of early August, the office market was tracking similarly to 2011, with three sales having already closed. The one rate of return extracted from this data implied a sub-5% overall rate of return by an owner occupant.
Light Industrial – The light industrial segment of the Teton County Commercial Real Estate Market saw five sales in 2011, a level reporting to the sales figure of 2010, and up from two sales in 2009. As owner-users dominate this market segment, the light industrial segment of the market has reported the lowest overall rates, with capitalization rates ranging from 4.1% to 4.51%. Four sales had occurred through the first week in August in the light industrial market segment, with owner-users dominating the market for light industrial condominiums and accepting sub-6% and sub-5% rate.
Hotel / Motel – National hostelry analysts had forecast an increase in lodging demand for 2012, with a forecast increase in Revenue Per Available Room of 5.8%. This estimate was recently revised after a strong first two quarters of this year, with the current increase in REVPAR for 2012 being forecast at 6.7%.1 Teton County hostelry properties appear to be on track and / or outpacing with this forecast, with the Rocky Mountain Lodging Report reporting an increase in REVPAR through July of 11.64%. Hostelry transactions happen sporadically in a community the size of Teton County. One sale of a smaller boutique hostelry property (9 room inn) occurred in 2011 for an 8% overall rate, with a 90-room independent property also being purchased for a rate of return of approximating 7%. As of the end of August, two larger hotels were nearing closure, as both the Snake River Lodge and Spa in Teton Village and the Snow King Hotel in the Town of Jackson were being purchased.
Vacant Land (Commercial) – During the approximate five years leading up to the current period, vacant commercial land has enjoyed strong price growth. This growth in price existed with most land type categories, but was most noticeable in the intensely-zoned UC (Urban Commercial) zoning district. This was largely due to the speculation that, through the use of the PMUD (planned mixed-use-development) provision of the Jackson Land Development Regulations, large amounts of building area could be profitably developed. Further fueling the price growth in land conducive to PMUD projects was the inclusion of residential product in PMUD developments. The influence being that many developers envisioned strong price growth for residential product and were willing to pay premium prices for land as a result. Land sales in the UC-zone progressed from price points in the $130 per square foot range in late 2005 to over $265 per square foot in 2008 . Vacant commercial land, and for that matter commercial real estate in general, has always sold with a speculative aspect to the purchase price. That is to say that the limited supply of commercial real estate had enabled sellers to obtain premium prices forcing buyers to purchase at price points that have not made economic sense at the time of purchase, but would eventually “pencil Subsequent to the spring of 2008, the bullish commercial market as outlined above was relatively inactive and is presumed to have remained flat until the September 2008 stock market “crash” that caused most market participants to acknowledge a correction. Consideration of sale and re-sale data (or active listing data in some cases) had shown devaluation in some instance that is greater than 60%. The intuition and data comparisons from previous years was further corroborated by data in the first half of 2012, with sales of the Wort parking lot property and the excavated former location of the McCabe Building selling at discounted price reflective of the “new market.” This phenomenon was also noted in Teton Village, where hostelry-oriented sites traded as steep discounts from previous highs, with one site sell for over 73% less than its high-water mark sale in 2007.
Summary
http://www.hospitalitynet.org/news/4057472.html
The real estate market in Teton County, Wyoming is one that has been typified by strong value growth over the past 20 years. An acceleration of this growth was noted in recent history. As a result of the recession that was triggered by what has come to be known as the “mortgage crisis,” property values have experienced a correction. This correction has been observed in both the residential and commercial market segments. After over four years of value erosion, review of data through early August of 2012 has provided the indication that values are currently in a stable value pattern for the first time since the onset of the recession. Barring any unforeseen economic events of a national or global magnitude, it does appear that real estate values have reached their bottom in Teton County. This is not to be construed as a forecast of increasing real estate values in the near future. However, with inventory shrinking and interest rates existing at or near the 50-year lows, at least it is now possible to say that the mechanics are in place where a strengthen of the Teton County real estate market could occur.


