Residential: Local Market Dominates Sales as Inventory Continues to Decline Commercial: Jackson
Commercial Property Values Remain Stable, Developers Enter Market With Speculators
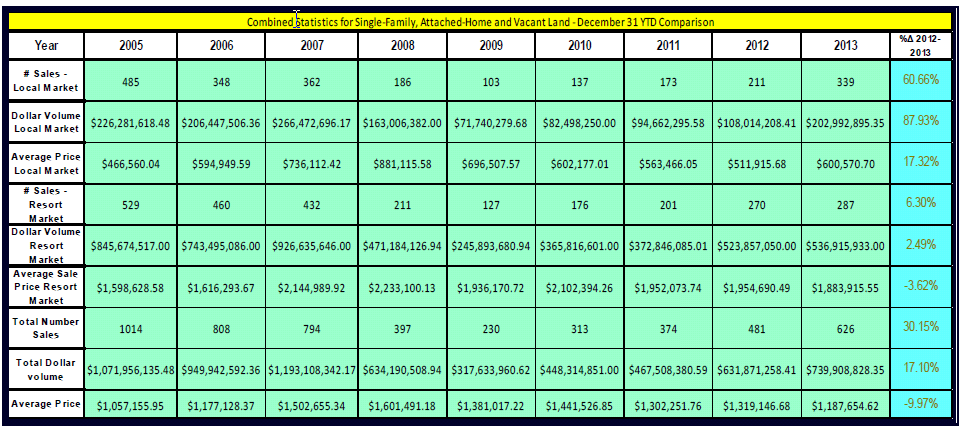
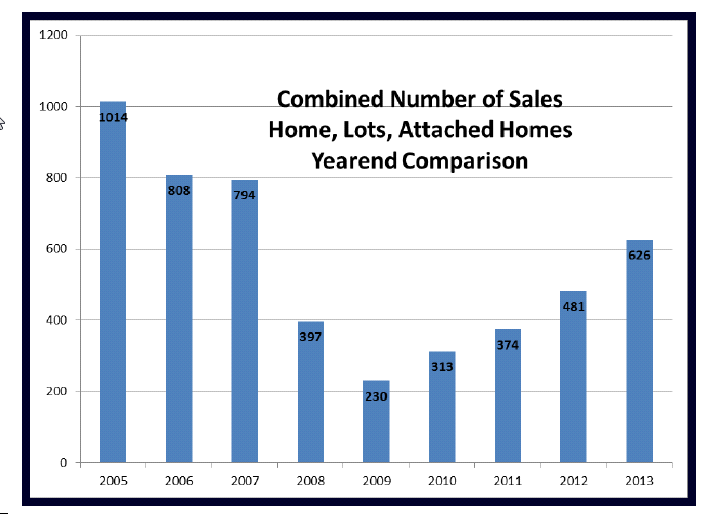
Residential – Observing data compiled through the end of 2013, it is noted that the number of residential real estate sales (single-family homes, attached homes, and vacant lots) are up from 481 total sales during 2012, to 626 sales this year (an increase of over 30%). This rate of increase is slightly greater than the 28.6% increase in number of sales observed when comparing 2012 volume to that of 2011. Notably, this yearend sale volume is only a rounded 23% less than the volume noted at this time in 2006 (the last year unaffected by the mortgage crisis of 2007). It could be argued that a low-twenties disparity in current sales volume numbers from that of 2006 is not a measure that is indicative of a recovery. However, when noting that the 2013 number of sales is 172% above the 2009 low recording of 230 sales, a more positive perspective is gained. It is also believed by many that a lack of inventory, not demand, is the primary limitation to greater sales volume figures. Further indication of the ongoing recovery is that the dollar volume of sales is up over 17% from the preceding year. The average price for real estate is down nearly 10%. However, this was due to an increase of more moderately price inventory being sold throughout the year to date, with the local-oriented market showing a 60% jump in number of sales, while the resort-oriented market only grew by 6.3% in transaction numbers. The intuition that the declining average sale price is due to the changing composition of the inventory of sold homes (and not value erosion) is further corroborated by the examination of individual property sales / re-sales, which provide the indication that values, on average, have been increasing between .25% and 1% since the market reaching an inflection point in mid-2011 (Value trends vary between market segments and property types.) Observation of active listings as of December 2013, shows that the available residential sales inventory is currently 10% less than it was at this time last year and currently only 21% above 2007 levels. While this presents a challenge for those seeking a home, it provides a benefit to the selling side of the equation.
Commercial – The number of commercial sales as of yearend was down slightly, but this drop is not seen as being a significant indicator of commercial activity due to the small sample size. Moreover, commercial capitalization rates remain bullish for Teton County, with office and retail properties most often yielding capitalization rates between 5% and 6%. A positive for the commercial market is also gleaned from the fact that developers are now competing for vacant land, removing this market from being the exclusive haunt of speculators and land bankers.
Combined Sales Data – All Property Types
(click on tables/charts to see enlarged view)
Summary of Market Statistics

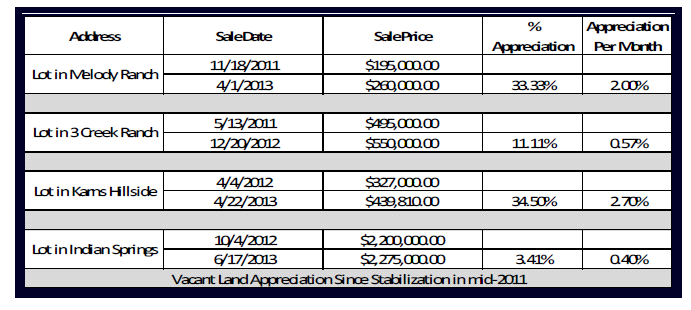
Vacant Homesite Market Segment
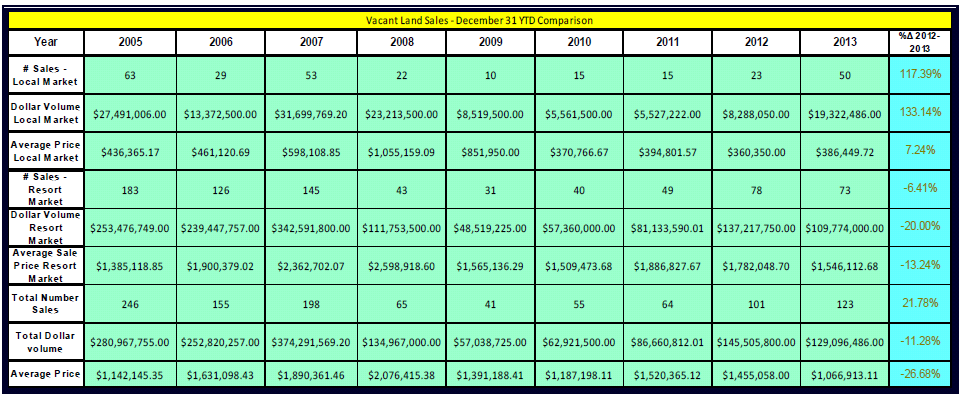
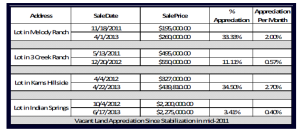
The vacant homesite market was up in number of sales by nearly 22%. This volume growth was heavily dominated by the local-oriented market, which showed an over 117% growth in number of transactions when compared to 2012. The heavy increase in transactions from the local market diluted the overall average sale price for vacant land. However, this should not be misconstrued as being indicative of value loss. On the contrary, comparisons of sales and re-sales of vacant land have shown a brisk rebound in value in several market segments since the observed ceasing of devaluation for most market segments in mid-2011. Furthermore, the decline in average price and sales volume of the resort vacant land market should not be misinterpreted as a stagnating of this market segment, as the first half of 2012 saw six sales in excess of $3,000,000, whereby not more than three had been seen for this time period since 2008. These highend lot sales (including one bulk purchase of three lots with prices greater than $5,000,000 each) totaled over $30,000,000, providing an anomalistic bump to the 2012 midyear numbers (which causes the misperception of a softening for the high-end land market in 2013).
 Attached Home (Condominium / Townhouse) Market Segment
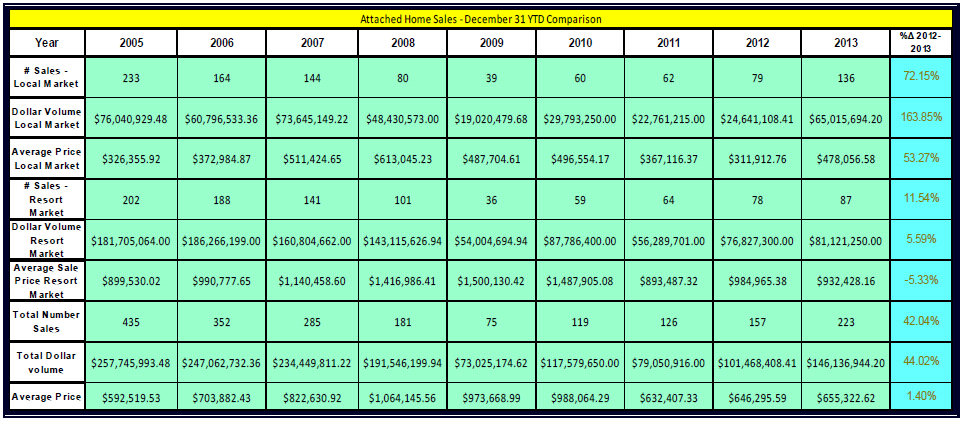
The number of sales in the attached home (condominium / townhouse) market was up 42% overall in 2013. Similar to the market for vacant land, this growth was dominated by the more moderately-priced local market. The result of this sales allocation being that only slight price growth was shown by the aggregate numbers, despite individual sale and re-sale comparisons showing more pronounced price growth since the 2011 inflection point of the sales pricing trends.
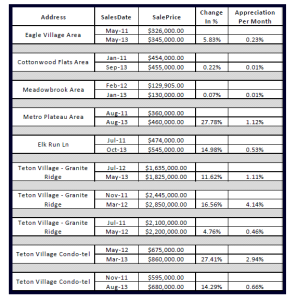 Single Family Market Segment
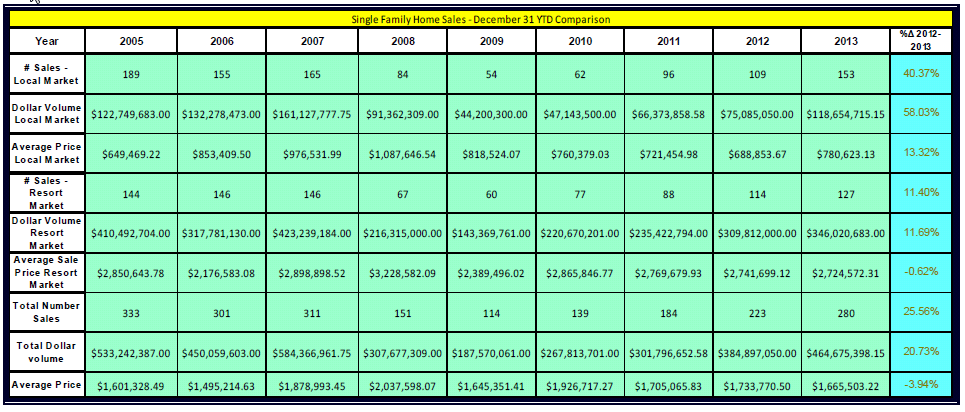
Single family home sales were up in number nearly 26%. Similar to the other market segments, this growth was largely fueled by the local market segment, which diluted aggregate price averages, despite homes in most market segments showing measurable price growth as is noted in the following table of sales and re-sales.

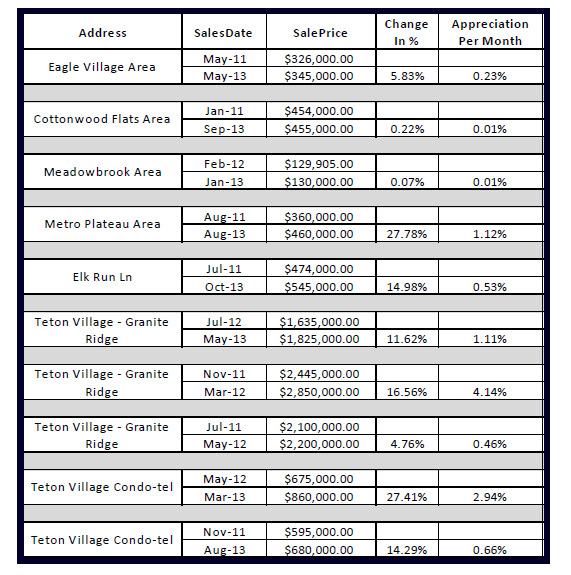
The result of the appreciation trend in many market segments has been the observance of price points that are approaching that of the high water marks noted in 2007 and 2008. Such value recapture has been most frequently noted in markets comprised of higher-end single-family residences, with attached homes still typically showing a greater disparity between current pricing and previous highs. The following table arrays data pertaining to tracked home sales and re-sales, with the initial sale occurring between January of 2007 and August of 2008, and the second sale (of the same property) occurring during the 2013 calendar year.
Recent Sales Price as a Percentage of Peak Values
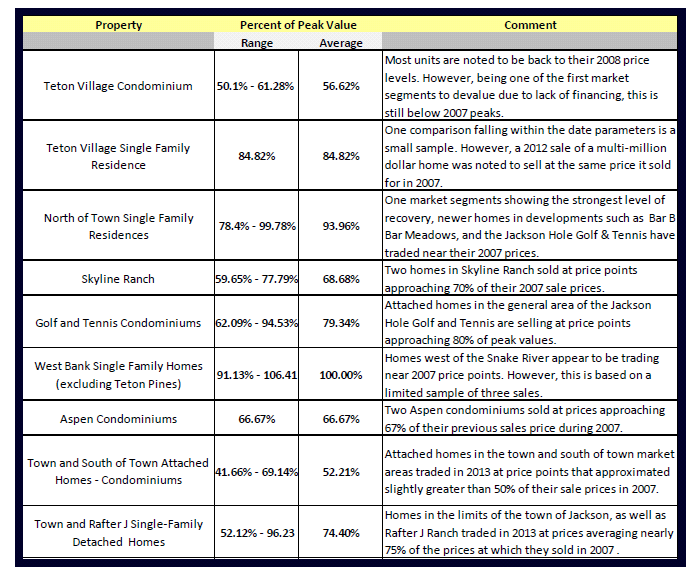
As can be noted in the preceding table, some single-family home segments appear to be approaching 2007 price points, while attached homes are remaining at a lesser percentage of peak values. An interpretation of this data to definitively state that any market segment is completely back to its 2007 price levels should be made with caution due to the limited sample size of comparisons available.
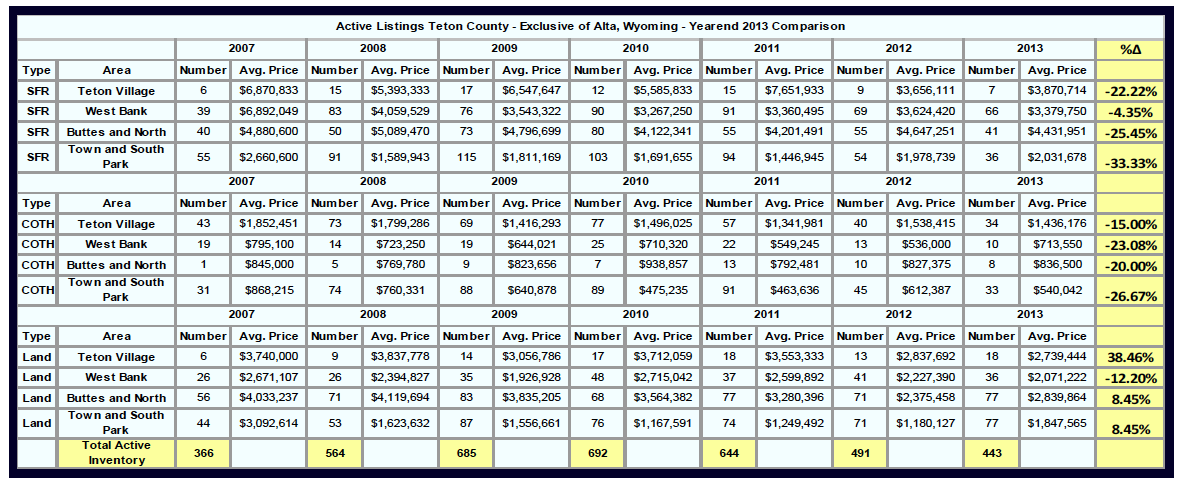
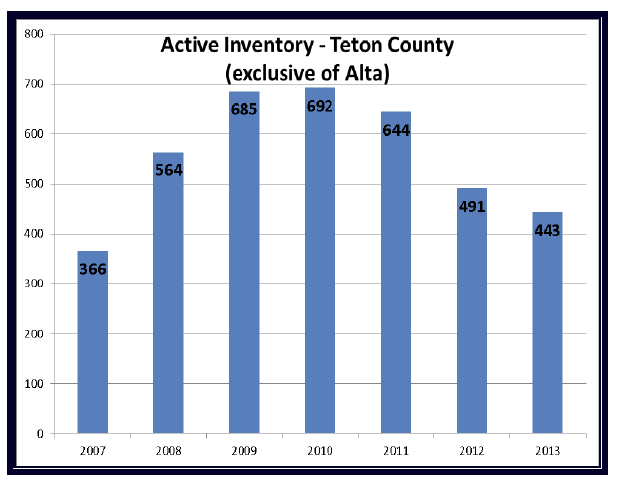
The Supply Side
The market has exhibited a shrinking inventory since 2010, with a lack of inventory now being cited by some real estate professionals as being an impediment to sales volume:
Real Estate – Commercial
Trend analysis of the Teton County commercial real estate market is hampered due to the size of the market area. That is to say that the relatively small number of commercial real estate transactions occurring create a situation where one sale can easily skew averages and median price data. Therefore, the health of the Teton County commercial real estate market is most accurately described without heavy dependence on statistical measures. That said, it was noted that the number of improved commercial sales in the Teton County market area numbered 16 sales, which is two less than the 18 sales that occurred in 2012 (with 18 also being the number of sales that occurred in 2011. When examining recent trends in rent and vacancy levels, it appears that vacancy for both office and retail has stabilized, with second-tier spaces still taking longer to lease than newer, better located spaces. Perhaps the previously hardest hit of commercial market segments had been development parcels that were slated to be redeveloped with mixed use buildings, often featuring ground floor retail and high-end residential condominiums on their upper floors. With the economic feasibility (and in some cases legal permissibility) of such developments becoming questionable in 2009, property values for such property lost as much as 70% of their value from previous peak levels. The year 2013 saw an indication that some bounce back was occurring in the vacant land market, with one premier development parcel selling for 50% of peak value (as opposed to the greater level of loss that had previously been hypothesized). Encouragingly, current land pricing, construction costs, and rent numbers can often be considered to create a new project that is economically feasible in today’s market. This is different than the pre-recession market, which required that a project’s construction costs would be justified by the hope of next year’s price increases.
Retail Market – The retail market for 2013 saw five sales. This was an increase from the two sales of the previous year, with the observed sales trading at overall capitalization rates of between 5% and 6%, a range that has remained relatively stable over the past two years. Rents for this market segment can range from $10.00 per square foot for large retail spaces suitable for big box tenants, to approaching $50.00 per square foot for spaces in proximity to the Jackson Town Square – with smaller “kiosk” spaces renting for even more. Leases had typically been written in a triple net format, with the tight retail market having allowed for well-located properties to command premium rental rates. However, vacancies rose throughout 2008-09 with reports of concessions being offered in both rental rates and interior build-out and landlord absorbing some building expenses (rather than passing them all through to tenants) being noted. Significantly discounted rents were noted to be negotiated during 2011. However, during 2012 and 2013, rents have been noted to stabilize at rates typically within 15% – 20% of peak values.
Office Market – The office market for 2012 saw only two sales of pure office space, a number two less than that of the two previous years. Capitalization rates accepted by investors and owner occupants typically existed between 5% and 6%, with some sales transacting at rates of return less than 5%. Prior to 2007, the office market in Teton County had been one of the stronger commercial sectors, with very little available space to rent. The shortage of office space that existed in 2007 spilled over into early 2008, before the contracting economy was acknowledged in this market segment. The contracting economy’s effect on this segment had been compounded by the completion of several large projects that were begun during the more robust economy. A lack of demand combined with increased inventory forced rental rates for office property downward at this time. Properties previously thought to have rental rates above $30.00 per square foot were being leased for less than $20.00 per foot. This trend began to stabilize during the summer of 2011, with some larger office projects that had been completed near the peak of the market achieving stabilized occupancy; 2012 and 2013 saw a slow but perceptible strengthening of the office market, with rents typically approaching levels within 15% of peak values.
Light Industrial – The light industrial segment of the Teton County Commercial Real Estate Market in 2013 saw seven sales, up one sale from the previous year. Most of these sales were properties suitable for owner-users, whose assumptions of full occupancy and personal use typically equated to overall rates less than 6%.
Hotel / Motel – One lodging property sold in 2013, on the heels of two large hostelry transactions occurring in 2012 (The Snow King Hotel in Jackson and the Snake River Lodge and Spa in Teton Village having been purchased). Heading into the winter season, hostelry operators were cautiously optimistic on the upcoming winter season with advance bookings reported to be slightly up in Teton Village, while reportedly remaining level for most in-town properties. The Rocky Mountain Lodging Report provides that revenue per available room (RevPar) for the Jackson market place was up approximately 4.5% as of yearend 2013.
Vacant Land (Commercial) – During the approximate five years leading up to the current period, vacant commercial land had enjoyed strong price growth. This growth in price existed with most land type categories, but was most noticeable in the intensely-zoned UC (Urban Commercial) zoning district. This was largely due to the speculation that, through the use of the PMUD (planned mixed-use-development) provision of the Jackson Land Development Regulations, large amounts of building area could be profitably developed. Further fueling the price growth in land conducive to PMUD projects was the inclusion of residential product in PMUD developments. The influence being that many developers envisioned strong price growth for residential product and were willing to pay premium prices for land as a result. As a result, land sales in Jackson’s more development-intensive zoning districts progressed from price points in the $130 per square foot range in late 2005 to over $265 per square foot in 2008. In 2012, two sales of properties that are similar to the properties that at the above-specified peak values sold for between $109 and $123 per square foot. A similar discount was reported for the UC zoned (Jackson’s most intense zoning designation) parcel on Broadway, which is reported to have sold for approximately 50% of its pre-2007 value. Teton Village saw heavily discounted prices in 2012, where the development parcels that were purchased in 2007 for the development of high end condominium hotel projects (reported Ritz Carlton and Little Nell Hotels) were sold out of foreclosure for discounts as great as 75% off of their previous acquisition prices. While those sites remain undeveloped, the first development project since the onset of the recession broke ground in the fall of 2013, with a larger combination residential / commercial project being presently underway. Encouragingly, this development, as well as that of the new Walgreens, is examples of land purchases that have occurred for development, rather than land banking or speculation.
Commercial Rental Supply and Demand – As was discussed in the previous analysis of the retail and office sectors, the rental market in Jackson appears to have stabilized. And, while no dramatic rebounds are be noted, the rental market appears to be slowly improving. As of January 2013, the Teton County MLS was reporting a combined tally of slightly over 27,000 square feet of office and retail space. This trend continued over the course of 2013, with 21,266 square foot of office and retail space as of January 2014. While not as tight as pre-2008 occupancy, this is in considerable contrast to 2009, when the addition of several new projects to the existing office retail space created an excess supply that was approximate to be as high as comprising 50,000 – 60,000 of unused space.
Data Provided by: