Sales Volume Lessens Amid Lower Home Inventory and Rising Prices In Lower Price Ranges – Appreciation Rates Remain Strong, but Stabilize at Higher Price Points
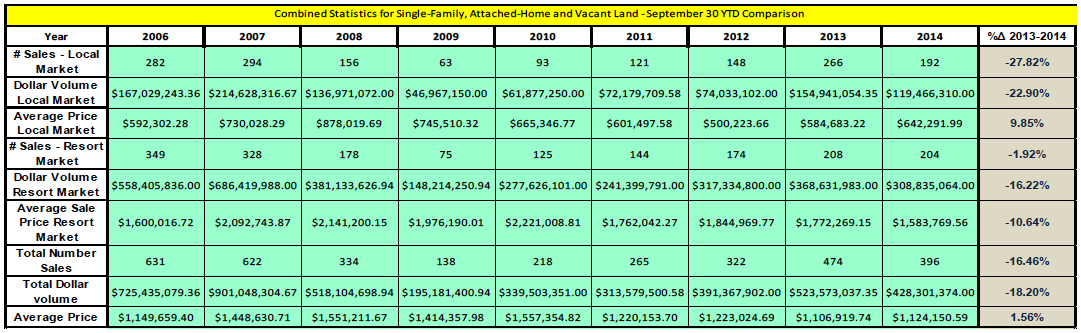
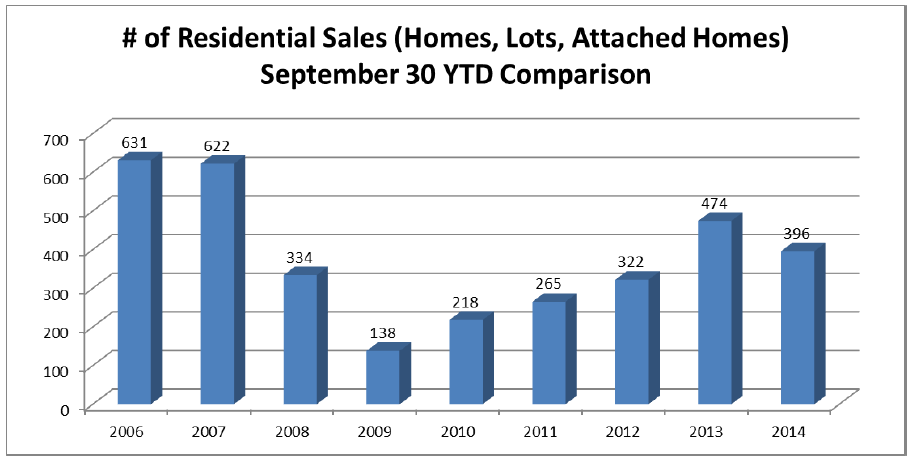
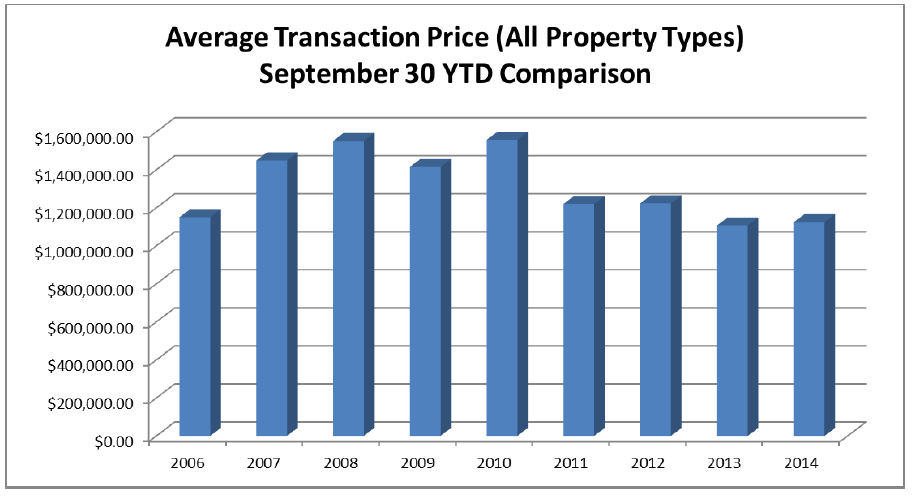
When compiling the data for single-family homes, vacant land and attached homes, the first three quarters of 2014 exhibited a contraction in the number of sales and total dollar volume of sales (as compared to the previous year to date) of over 16%. This phenomenon is attributed to a decrease in listing inventory, with the inventory as of mid- October being almost 20% less than it was the same time last year. As a result of this market tightening, single-family home sales are off in number by over 23%. The number of attached home sales and vacant land sales are also down (7.45% and 16.49% respectively) but not to the degree of detached, improved residences. It was hypothesized during the mid-year market report that the earlier recovery of the single-family housing market gave many single-family home sellers the confidence to “test the waters” with higher asking prices at the beginning of the summer sales season, causing a standoff between buyers and sellers. At that time the question was also raised as to whether sellers would reducing asking prices by the end of the year in recognition of the continued standoff. As of the close of the third quarter, it was noted that prices remained strong despite contracting sales volume, with no indication of sellers lessening their expectations. Higher-end single-family properties seem to have stabilized from their upward pricing trend, with no definitive indication of price movement in this segment. The aggregated data for residential real estate sales showed a small increase in average price (1.56%) from Q3, 2013, with this indication hypothesized to be the result of continued appreciation in the lower-priced segments of the market and a combination of stabilized pricing and fewer sales at the upper end of the market. An exception to this would be the high-end vacant land market, which exhibited an increase in sales volume in YTD 2014.
(click on tables/charts to see enlarged view)
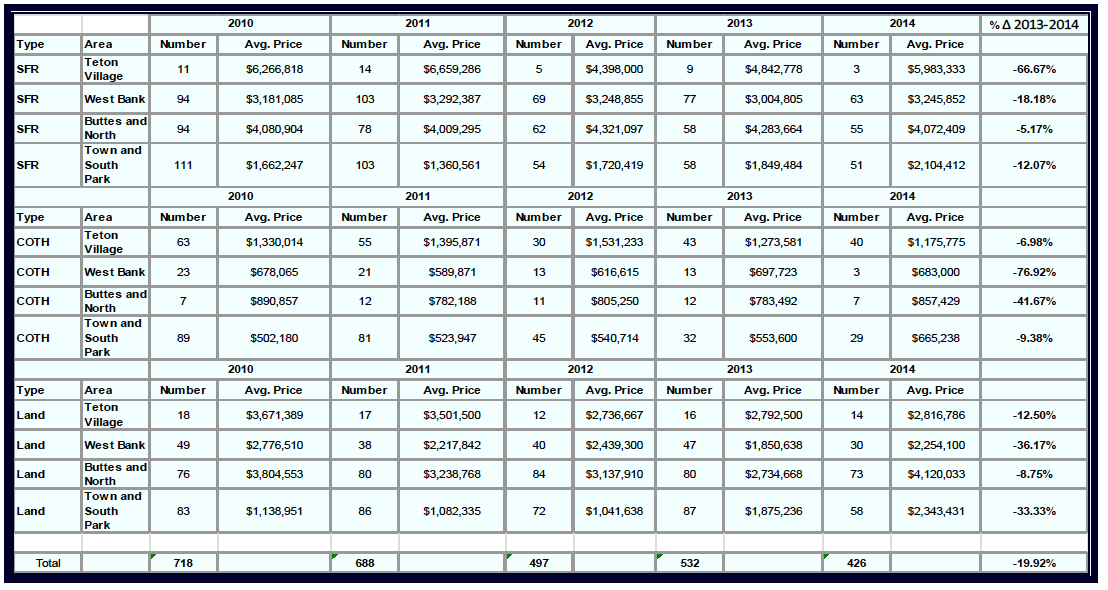
Single-Family Home Sales Trends – Third Quarter Comparisons:
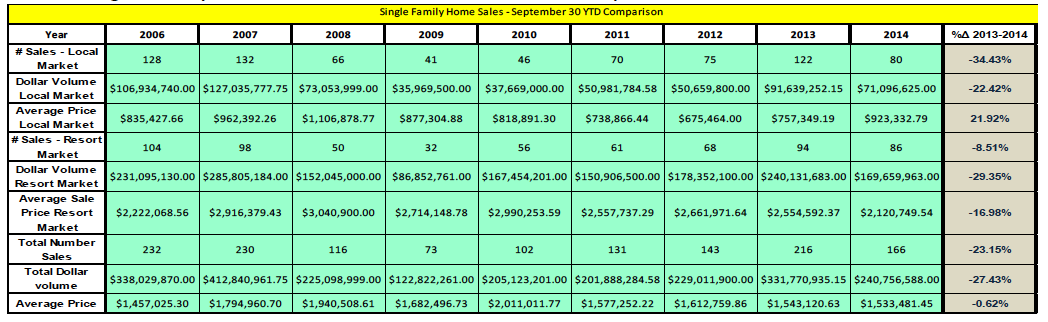
Single-Family Home Sales were off 23.15% in number of sales as of the end of the third quarter, with local market bearing the brunt of this loss (an over 34% decrease as compared to a contraction of 8.51% for the resort market). This loss is opined to be fueled by limited sales inventory pushing prices out of reach of many price-conscious buyers. As an example, the below table shows the escalation of average listing prices in Rafter J Ranch Subdivision, which is opined to be contributory to a decrease in number of sales in this development from 16 sales (3rd Quarter YTD in 2013) to 7 sales (3rd Quarter YTD in 2014).

In observing closed transactions, sales prices for single-family residences were noted to be essentially flat from last year based on the overall average price indication. However, observation of sales and re-sales of same or similar individual properties contradicts this indication, with indications being that properties have been appreciated at rates approaching 1% per month (average / not compound) during recent months. Digging deeper into the data it becomes apparent that the moderation of the price growth indicated by the averaged data is an over-conservative measure resulting from the banner year at the upper reaches of high end home sales in 2013 (25 sales at or above $3M – totaling over $150M), which was not matched in 2014 (24 sales at or above $3M – Totaling $110M). As is implied by the preceding numbers, less “ultra luxury” sales occurred in 2014, with only one sale in excess of $10,000,000 occurring in the first three quarters of 2014, as compared to four of such sales in the same period of 2014.
Vacant Land Sales Trends – Third Quarter Comparisons:
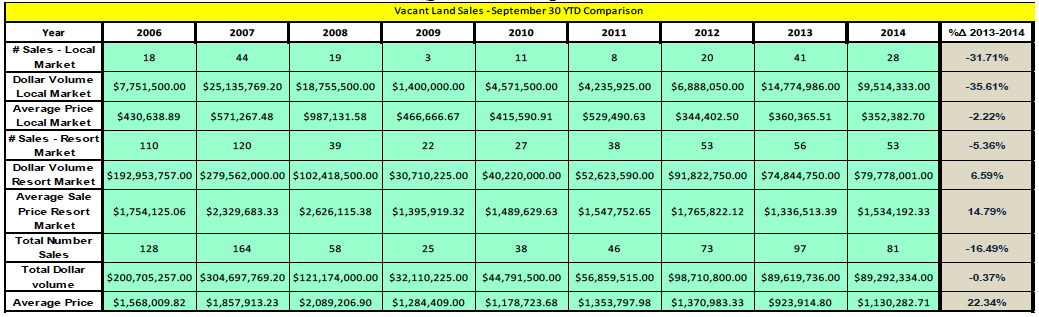
Vacant land sales decrease in number by over 16% when comparing YTD 2014 to YTD 2013. While this held true for both local and resort market segments, it is observed that the total number of lot sales occurring in 2014 is still over 10% above 2012 reporting, perhaps indicating that recent drops in sales number may be more a function of 2013 being an atypically good year (rather than 2014 being an off year). The average sales price of vacant land is noted to be up over 22% for 2014, which is likely an overzealous indication of individual property appreciation rate due to an increase in higher end land sales as opposed to the sales in the local market. More specifically, it was noted that lot sales greater than $2,000,000 comprised nearly 19% of total homesite sales in Q1-Q3 of 2014, while only approximating 10% of the total sales during the same period of the previous year.
Attached Home Sales Trend – Third Quarter Comparisons:
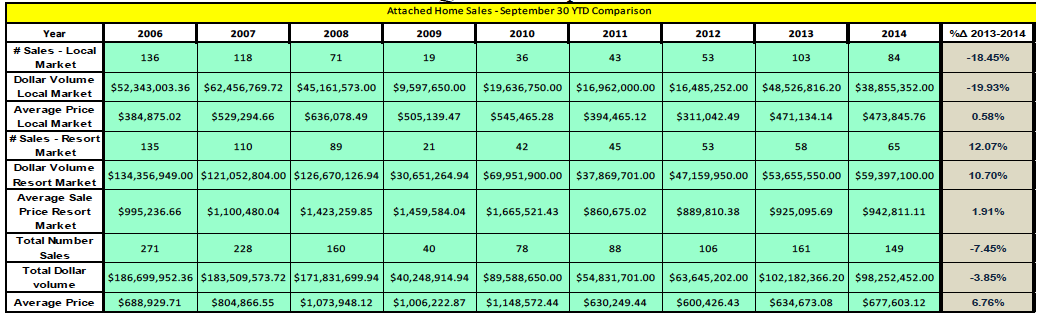
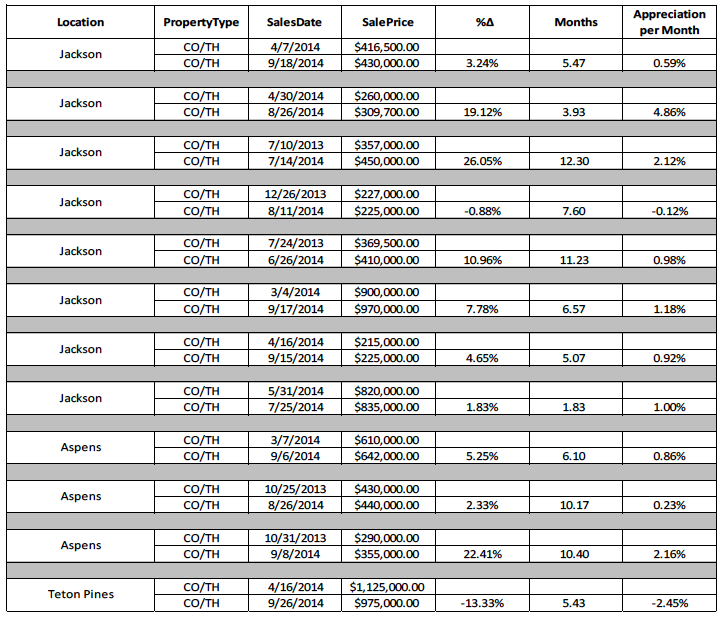
Attached homes (Condominium / Townhouse) in Teton County, were off by 7.45% as of the end of the third quarter, a lesser degree than the single-family and vacant land market segments. The local market lost the most sales volume comparatively, with sales of units in the Aspens and Teton Shadows (Jackson Hole Golf and Tennis Area) bolstering the sales volume for resort properties. Average prices increased by nearly 7% when considering 2014 sales data as compared to YTD data from 2013. However, comparison of sale and re-sales of individual units showed price increases averaging approximately 1% per month over the period beginning at mid-year 2013.
Attached Home Appreciation – Sales / Re-sales:
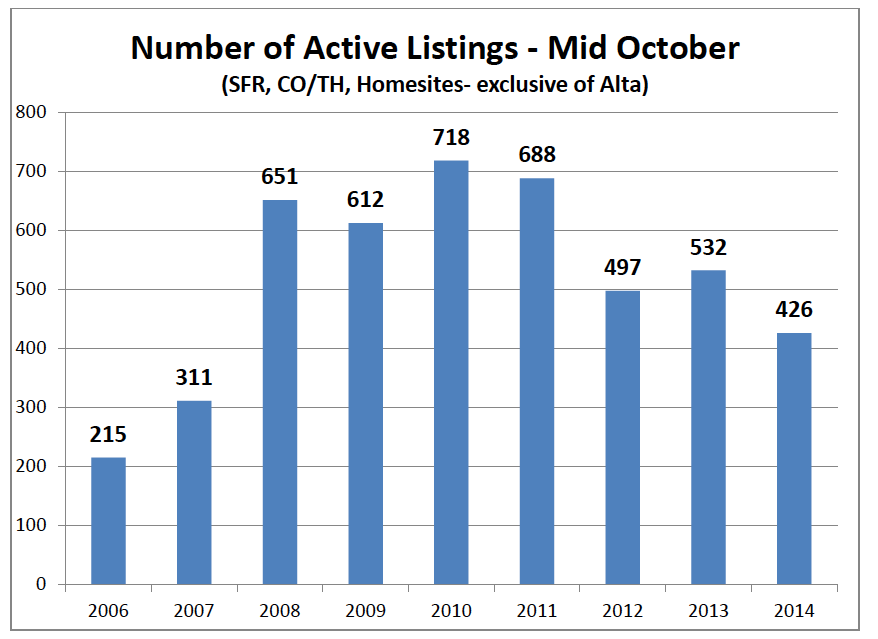
Active Inventory
The inventory of homes grew from a shortage of available inventory in 2007, to an oversupply in 2010, following the events of the financial crisis. Since 2010, a marked downward trend has been noted, with inventory being above that of 2007 levels, but at a level that is opined to be a shortage by many real estate professionals. This trend continued in 2014, with inventory being down approximatley 20% overall. The greatest reduction in inventory was noted in the resort areas of Teton Village, West Bank (Aspens) and Jackson Hole Golf and Tennis (Teton Shadows) areas.
Historical Active Inventory Levels as of 3rd Quarter End:
Andrew Cornish | Broker
PO Box 9467 | 155 E. Pearl, Suite 10
Jackson, WY 83002
(307) 733.8899 | (307) 413.7799 cell
Cornish | Lamppa
The Brokerage Team For Your Real Estate Needs

Data provided by Rocky Mountain Appraisals, Teton County’s leading valuation firm: